
EIA’s New England Energy Dashboard Puts the Region’s Pipeline Crisis in Focus
New England’s energy crunch has hit such crisis levels that the Energy Information Administration this week launched a dashboard to track it, further illustrating the dangerous and false narrative put forth by “Keep It In the Ground” activists that the region doesn’t need more pipeline infrastructure. As EIA explains,
“Energy delivery infrastructure constraints and outages can have a pronounced influence on New England’s wholesale energy prices, energy flows, and operations. As a result, the New England Dashboard illustrates these constraints.”
Yet, just a day after the dashboard launched, these activists are still saying the supply constraint issue that New Englanders face every winter is something the gas industry made up:
The gas industry would love to have us believe that New England has a gas supply problem and that the only solution is to build *more* infrastructure, like a massive new pipeline, at taxpayer expense. But that would threaten the health and safety of communities across the region.
— Conservation Law Fnd (@CLF) January 24, 2019
Notably, grid operator ISO New England has also raised the alarm around this situation:
“During the last few years, inadequate infrastructure to transport natural gas has at times affected the ability of natural-gas-fired plants to get the fuel they need to perform. This fuel-security risk has become a pressing concern in New England, considering the major role natural-gas-fired generation plays in keeping the lights on and setting prices for wholesale electricity.”
“The performance of the largest and most flexible sector of generators is weakened by insufficient pipeline and storage capacity.”
EIA’s dashboard will allow consumers to monitor everything from pricing to potential outages on a daily basis. Although it currently includes data for only a few days under “normal” market conditions, the information is already incredibly insightful.
Let’s look at the facts:
Natural gas still reigns in New England.
With no natural gas production of its own, New England imports from both domestic and foreign sources more than 3 billion cubic feet of natural gas daily (bcf/d) under these “normal” winter market conditions. That represents nearly 10 percent of the 31.6 bcf/d produced in the Appalachian Basin about 300 miles away.
And total natural gas consumption in the region has reached a peak of more than 6 bcf/d already this year, or around 19 percent of Appalachian Basin production. That’s higher than the total consumption during the polar vortex in January 2018.

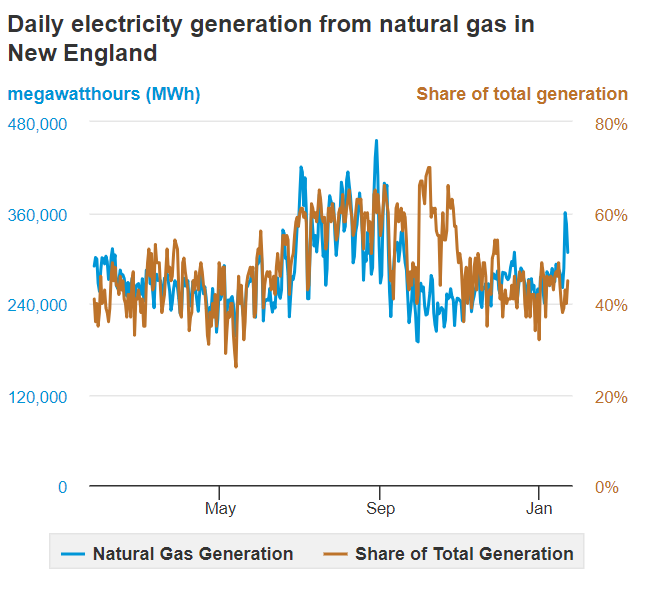
The residential and commercial sectors consume the most natural gas, followed by electricity generation.

Natural gas generated between about 46 and 50 percent of New England’s electricity this week, according to the dashboard.

However, at some points in the past year natural gas-fired electricity generation reached as high as 70 percent – predominantly during summer and fall months when demand for natural gas is not as high across the country.
LNG to the rescue.
The pipelines supplying this natural gas to New England are operating at nearly 74 percent capacity and delivering just under 4 bcf/d. Most of this supply comes from pipelines that run through New York – which has continuously blocked new infrastructure – and New Jersey.

Simple math shows that when natural gas consumption spikes over 5.4 bcf/d – and that’s actually a high estimate – there is not enough pipeline capacity to meet the region’s demand. So where else do ISO-NE and natural gas utility suppliers get their gas?
In addition to some storage capacity, to meet high demand days the region imports liquified natural gas (LNG). Because of the Jones Act that places restrictions on U.S. LNG imports from domestic terminals, all of this LNG is internationally supplied. As the Sentinel and Enterprise reported in December:
“The New England region is one of the only parts of the country that still imports large quantities of foreign LNG, according to the U.S. Department of Energy. Four of the country’s 11 LNG-receiving terminals had taken shipments of foreign LNG this year through October, but the terminal in Everett took shipments each month and has accounted for 84 percent of the imported volume — 48 billion cubic feet.” (emphasis added)
The Everett, Mass., import terminal accepted more than 10.8 billion cubic feet of natural gas in January 2018 when the region was hit with a polar vortex, according to EIA. But as the following daily import data from EIA’s dashboard show, it may well be on a trajectory to surpass those figures with LNG imports more than double those of last year so far this month.
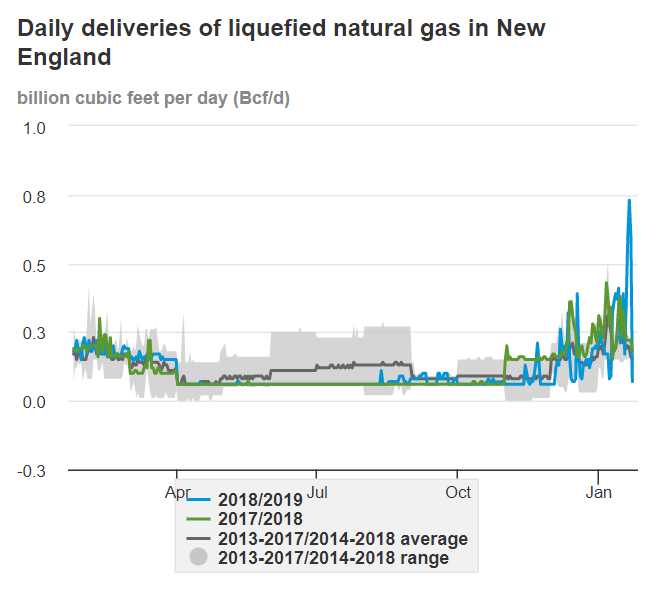
And while nearly all of this LNG is supplied by Trinidad and Tobago, at least one shipment last year actually originated from a sanctioned LNG export facility in Russia. This past December another tanker carrying Russian LNG was advised to change course on its way to Canada and be prepared to deliver its shipment to Boston. It does not appear to have unloaded in Boston, but it shows that the pipeline constraints in the region place New Englanders in a precarious situation, reliant on foreign fuel, each winter.
When natural gas is in short supply, New England turns to higher-emitting fuel sources.
Somewhat colder-than-average temperatures at the beginning of this week also led to the region using more traditional fuel sources to meet electricity demand. Coal and petroleum accounted for between 5.7 and 7.1 percent of the electricity generation mix on Tuesday and Wednesday, while solar hovered at zero and wind ranged from 3.6 to 4.3 percent.
This situation really gets to the heart of the false “Keep It In the Ground” premise that more pipeline infrastructure is not needed in New England. The movement’s platform claims to be based on reducing emissions, but without proper pipeline capacity the region is forced to look to higher-emitting alternatives to keep the lights on and heat flowing to New Englanders. The new EIA dashboard clearly shows that for the foreseeable future, it is not renewables that will meet that supply-demand gap.
Without more pipeline capacity, and as older power plants retire, it won’t just be Rhode Islanders facing periods of outages. As ISO-NE has warned, “the grid is likely to be at risk of fuel shortages and rolling blackouts.”
No Comments