Report: U.S. Continued to Decrease Emissions In 2019 Alongside Increased Natural Gas Production, Demand
While global carbon emissions saw a slight increase in 2019, the United States continued its long-term trend of reducing these emissions – at the same time that natural gas production and demand continued to increase – according to BP’s 2020 Statistical Review of World Energy.
This year’s edition was published amidst one of the most impactful events of the last century: a global pandemic that turned our entire way of living upside-down. The pandemic has triggered both direct and indirect impacts across the entire energy sector, which have just started to be seen and felt. And although it is too early to predict long-term impacts, the report offers a snapshot of global energy prior to this event.
Here are three important trends from BP’s latest report:
#1 U.S. Natural Gas Saw Increased Supply and Demand
Natural gas continued to be an important fuel source in 2019. On the demand side, natural gas global consumption increased by 2.7 trillion cubic feet (tcf), 2 percent more than the previous year. Although growth slowed down compared to 2018, the share of natural gas in the primary energy matrix rose to a record high of 24.2 percent.
Natural gas demand was driven by two countries: The United States (953.5 billion cubic feet) and China (846 bcf). According to the report, the decline in gas consumption growth can be attributed to mild weather in 2019, which required less natural gas during winter, as well as the plateauing of the Chinese coal-to-gas shift policy implemented in recent years.

The supply side of the equation also showed promising results. During 2019, global natural gas production grew by 3.4 percent – a 4.6 tcf rise. The countries responsible for that increase include, again, the United States (3 tcf), whose production represents almost two thirds of this increase, followed by Australia (812 bcf) and China (546 bcf).

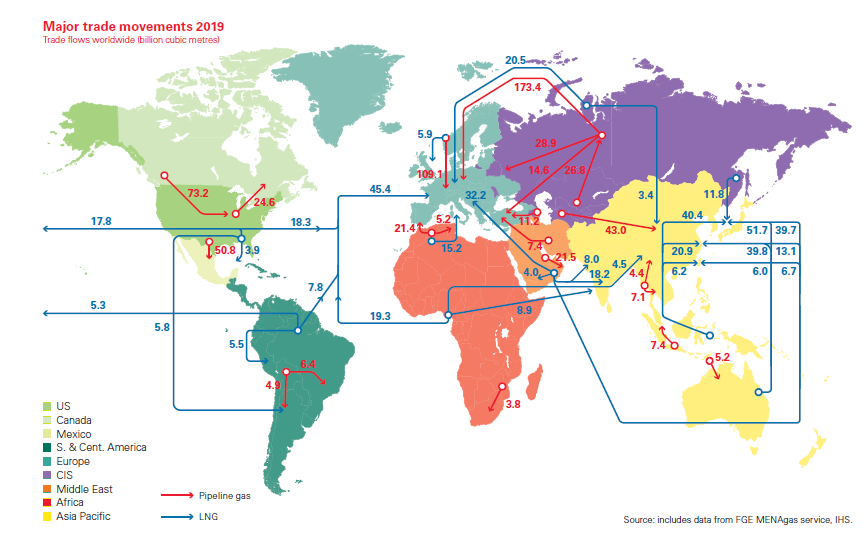
Natural gas production growth was driven by increased liquefied natural gas exports, which grew by 12.7 percent in 2019. LNG supply growth was led by the United States (670 bcf) and Russia (494 bcf).
Notably, unlike in 2018, when most LNG growth was driven by Asian markets, in 2019 European LNG imports rose more than two thirds:
“European LNG imports rose by 1.73 tcf, representing an unprecedented 68 percent increase. Growth was widespread, with the UK (388 bcf), France (353 bcf) and Spain (247 bcf) the largest individual contributors”.
LNG’s rapid growth also led to a 4.9 percent increase in overall inter-regional gas trade. This is despite a 1.7 percent decline in pipeline trade (-317 bcf) in the European case from Russia and North Africa.

#2 Natural Gas Is the Preferred Power Source for Most of the World
At this point, it is more than evident that natural gas holds an increasingly dominant position in the global markets. Although coal continues to be the most used energy source in net numbers, the gasification of power grids worldwide has positioned natural gas in a unique, geostrategic spot:
“Natural gas is the dominant fuel used for power generation in North America, CIS, the Middle East and Africa”.
In fact, the shares of natural gas rose to record levels in 2019, representing 23.3 percent of the observed growth. As we can see from the graph below, natural gas dominates in more regions, and even in those where natural gas is not the de facto power source, it follows closely after.
While natural gas gains can be partially explained by coal’s power generation plunge of 1.5 percent – the greatest decrease on record since 1985 – it is evident that natural gas has established itself as the power source of choice for most markets.

#3 U.S. Carbon Emissions Declined, While Global Emissions Slowed But Still Increased
BP reports that global carbon emissions grew by 0.5 percent in 2019, slowing down significantly after a sharp increase in 2018. Although it might be too early to celebrate the slower pace of emissions growth, the reasons behind the slowdown hints at natural gas’ major role worldwide. According to the report, two main factors influenced this outcome:
“The combination of slower growth in energy demand and a shift in the fuel mix away from coal and toward natural gas and renewables led to a significant slowdown in the growth of carbon emissions”.
Case in point, the United States has enjoyed diminishing CO2 emissions for more than 10 years, and it has done it by positioning natural gas at the center of the country’s energy transition. According to BP’s report, in 2019 the United States reduced its CO2 emissions by 3 percent – the most significant in North America. And as the graph below shows, the U.S. has consistently decreased its emissions every year.

Simply put, the rise in natural gas demand has been fundamental to slow down carbon emissions growth, both in the United States and, soon, globally.
Conclusions:
The biggest take away from BP’s 2020 Statistical Review is U.S. natural gas’ predominant role in the entire global energy market. The United States has contributed significantly to the ongoing transformation of the energy ecosystem today. From supplying the world with affordable and reliable natural gas to leading on the gasification of its power grid, and in turn, reducing carbon emissions. U.S. natural gas has positioned itself as the fastest growing, low-emission energy source in recent years.

No Comments