Home
About
Fracking 101
Resources
All
Fact Sheets
Infographics
Videos
Gasland Debunked
Regions
All
National
California
Florida
Mountain States
New Mexico
App. Basin
Texas
Canada
Key Issues
Health
Climate
Pavillion
Federal Lands
Home
About
Fracking 101
Resources
All
Fact Sheets
Infographics
Videos
Gasland Debunked
Regions
All
National
California
Florida
Mountain States
New Mexico
App. Basin
Texas
Canada
Key Issues
Health
Climate
Pavillion
Federal Lands
Infographics
Infographics
May 03, 2024
EIA-Power Sector Emissions Reductions 2006-2023
Infographics
Nov 10, 2023
Petroleum and You: Thanksgiving Day Parade
Infographics
Oct 27, 2023
Petroleum and You: Oil and Gas Products Are Integral to Halloween
Infographics
Jun 30, 2023
Petroleum and You: Cosmetics
Infographics
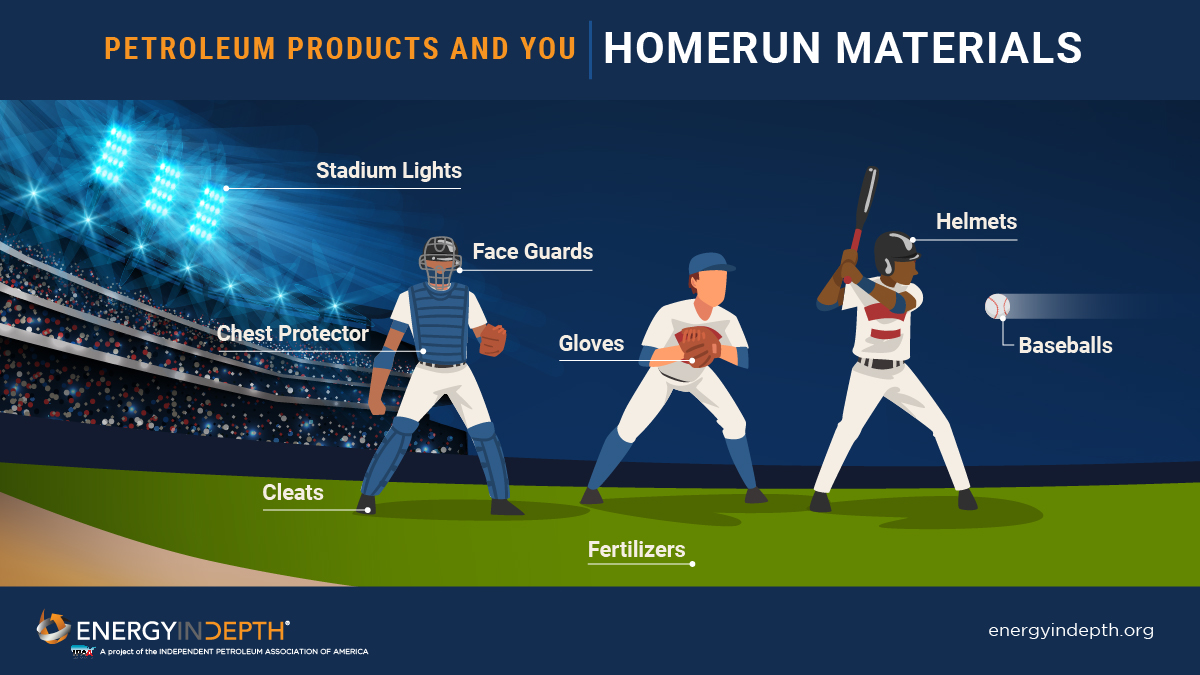
Mar 17, 2023
Petroleum and You: Homerun Materials
Infographics
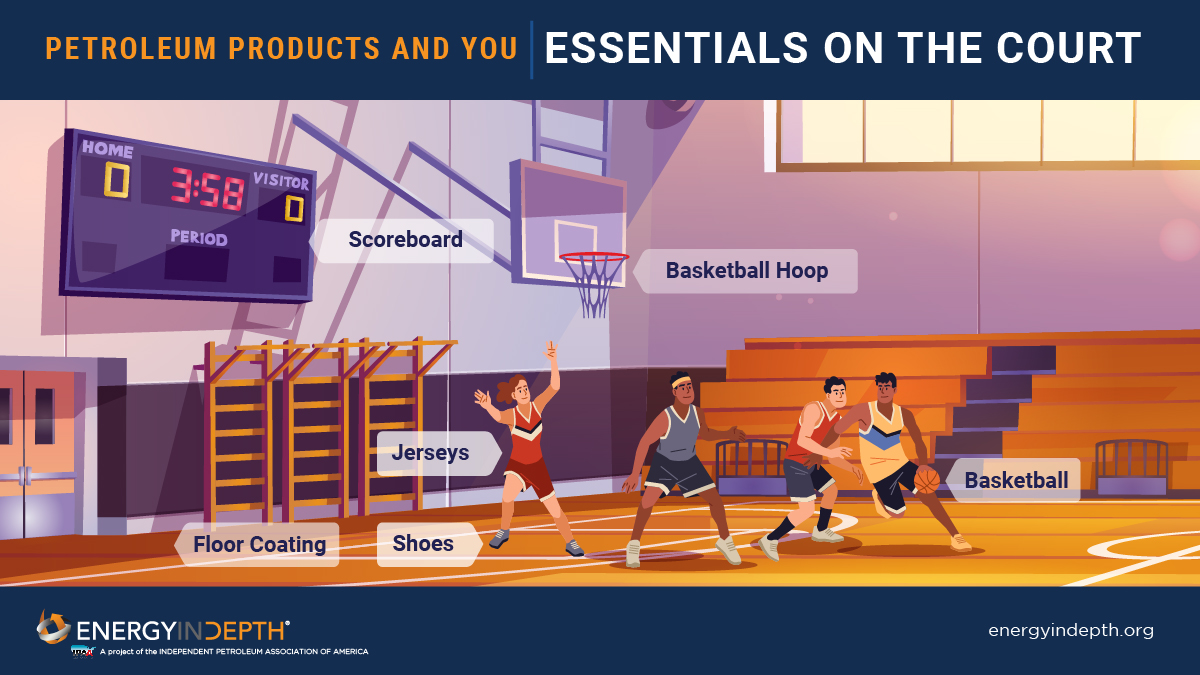
Mar 17, 2023
Petroleum and You: Essentials on the Court
Infographics
Feb 22, 2023
After a Decade in the Making, Private Property Rights Win in Ohio
Infographics
May 18, 2022
Petroleum and You: Feeding the World
Infographics
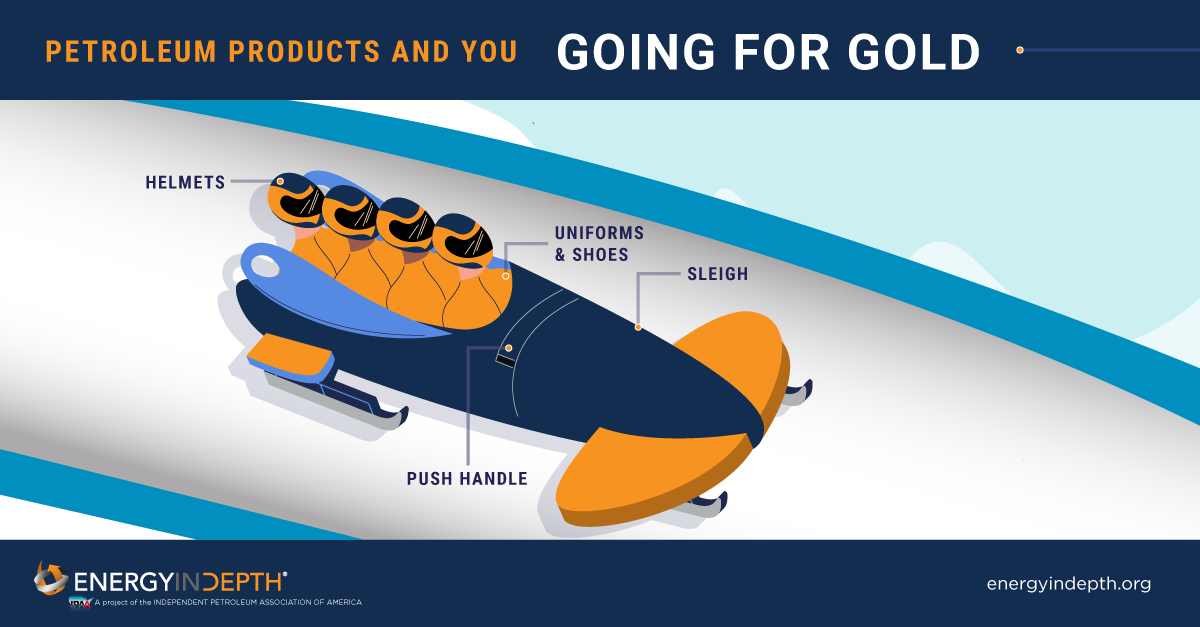
Feb 07, 2022
Petroleum and You: Going For Gold
Infographics
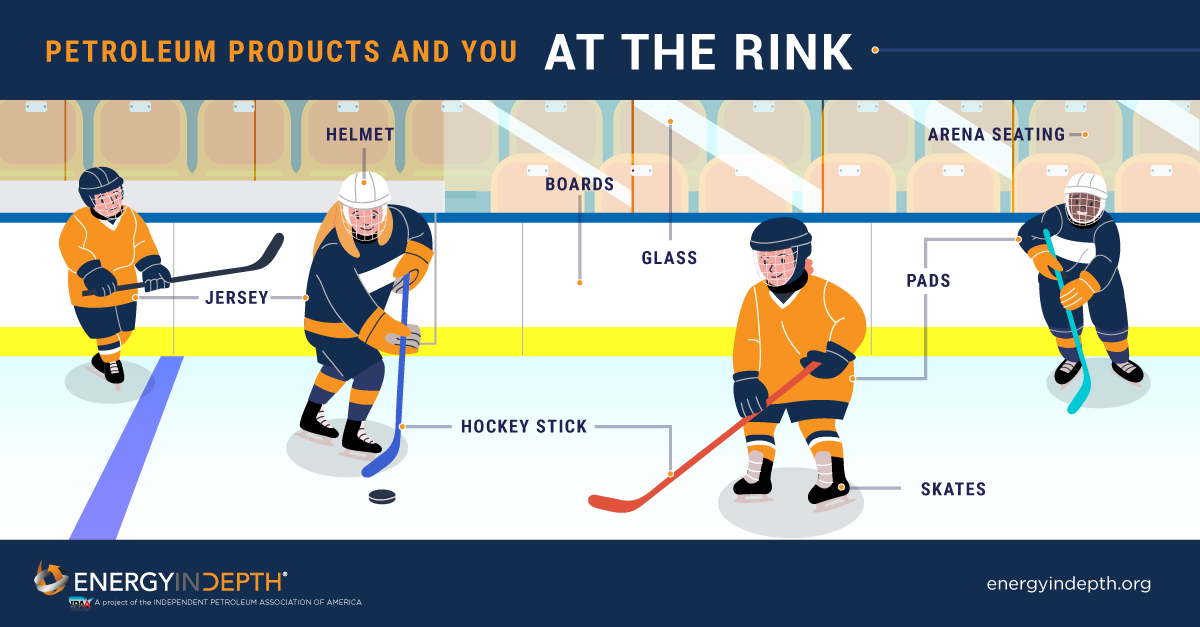
Feb 07, 2022
Petroleum and You: At The Rink
Infographics
Feb 07, 2022
Petroleum and You: On The Mountain
Infographics
Jan 31, 2022
Petroleum and You: Snow Day
1
2
3
4
5
6
7