Home
About
Fracking 101
Resources
All
Fact Sheets
Infographics
Videos
Gasland Debunked
Regions
All
National
California
Florida
Mountain States
New Mexico
App. Basin
Texas
Canada
Key Issues
Health
Climate
Pavillion
Federal Lands
Home
About
Fracking 101
Resources
All
Fact Sheets
Infographics
Videos
Gasland Debunked
Regions
All
National
California
Florida
Mountain States
New Mexico
App. Basin
Texas
Canada
Key Issues
Health
Climate
Pavillion
Federal Lands
Infographics
Infographics
Dec 21, 2021
Petroleum and You: Holiday Edition
Infographics
Apr 20, 2021
U.S. GHG Emissions, 2005-2019
Infographics
Apr 20, 2021
U.S. Power Sector CO2 Emissions, 2005-2019
Infographics
Apr 20, 2021
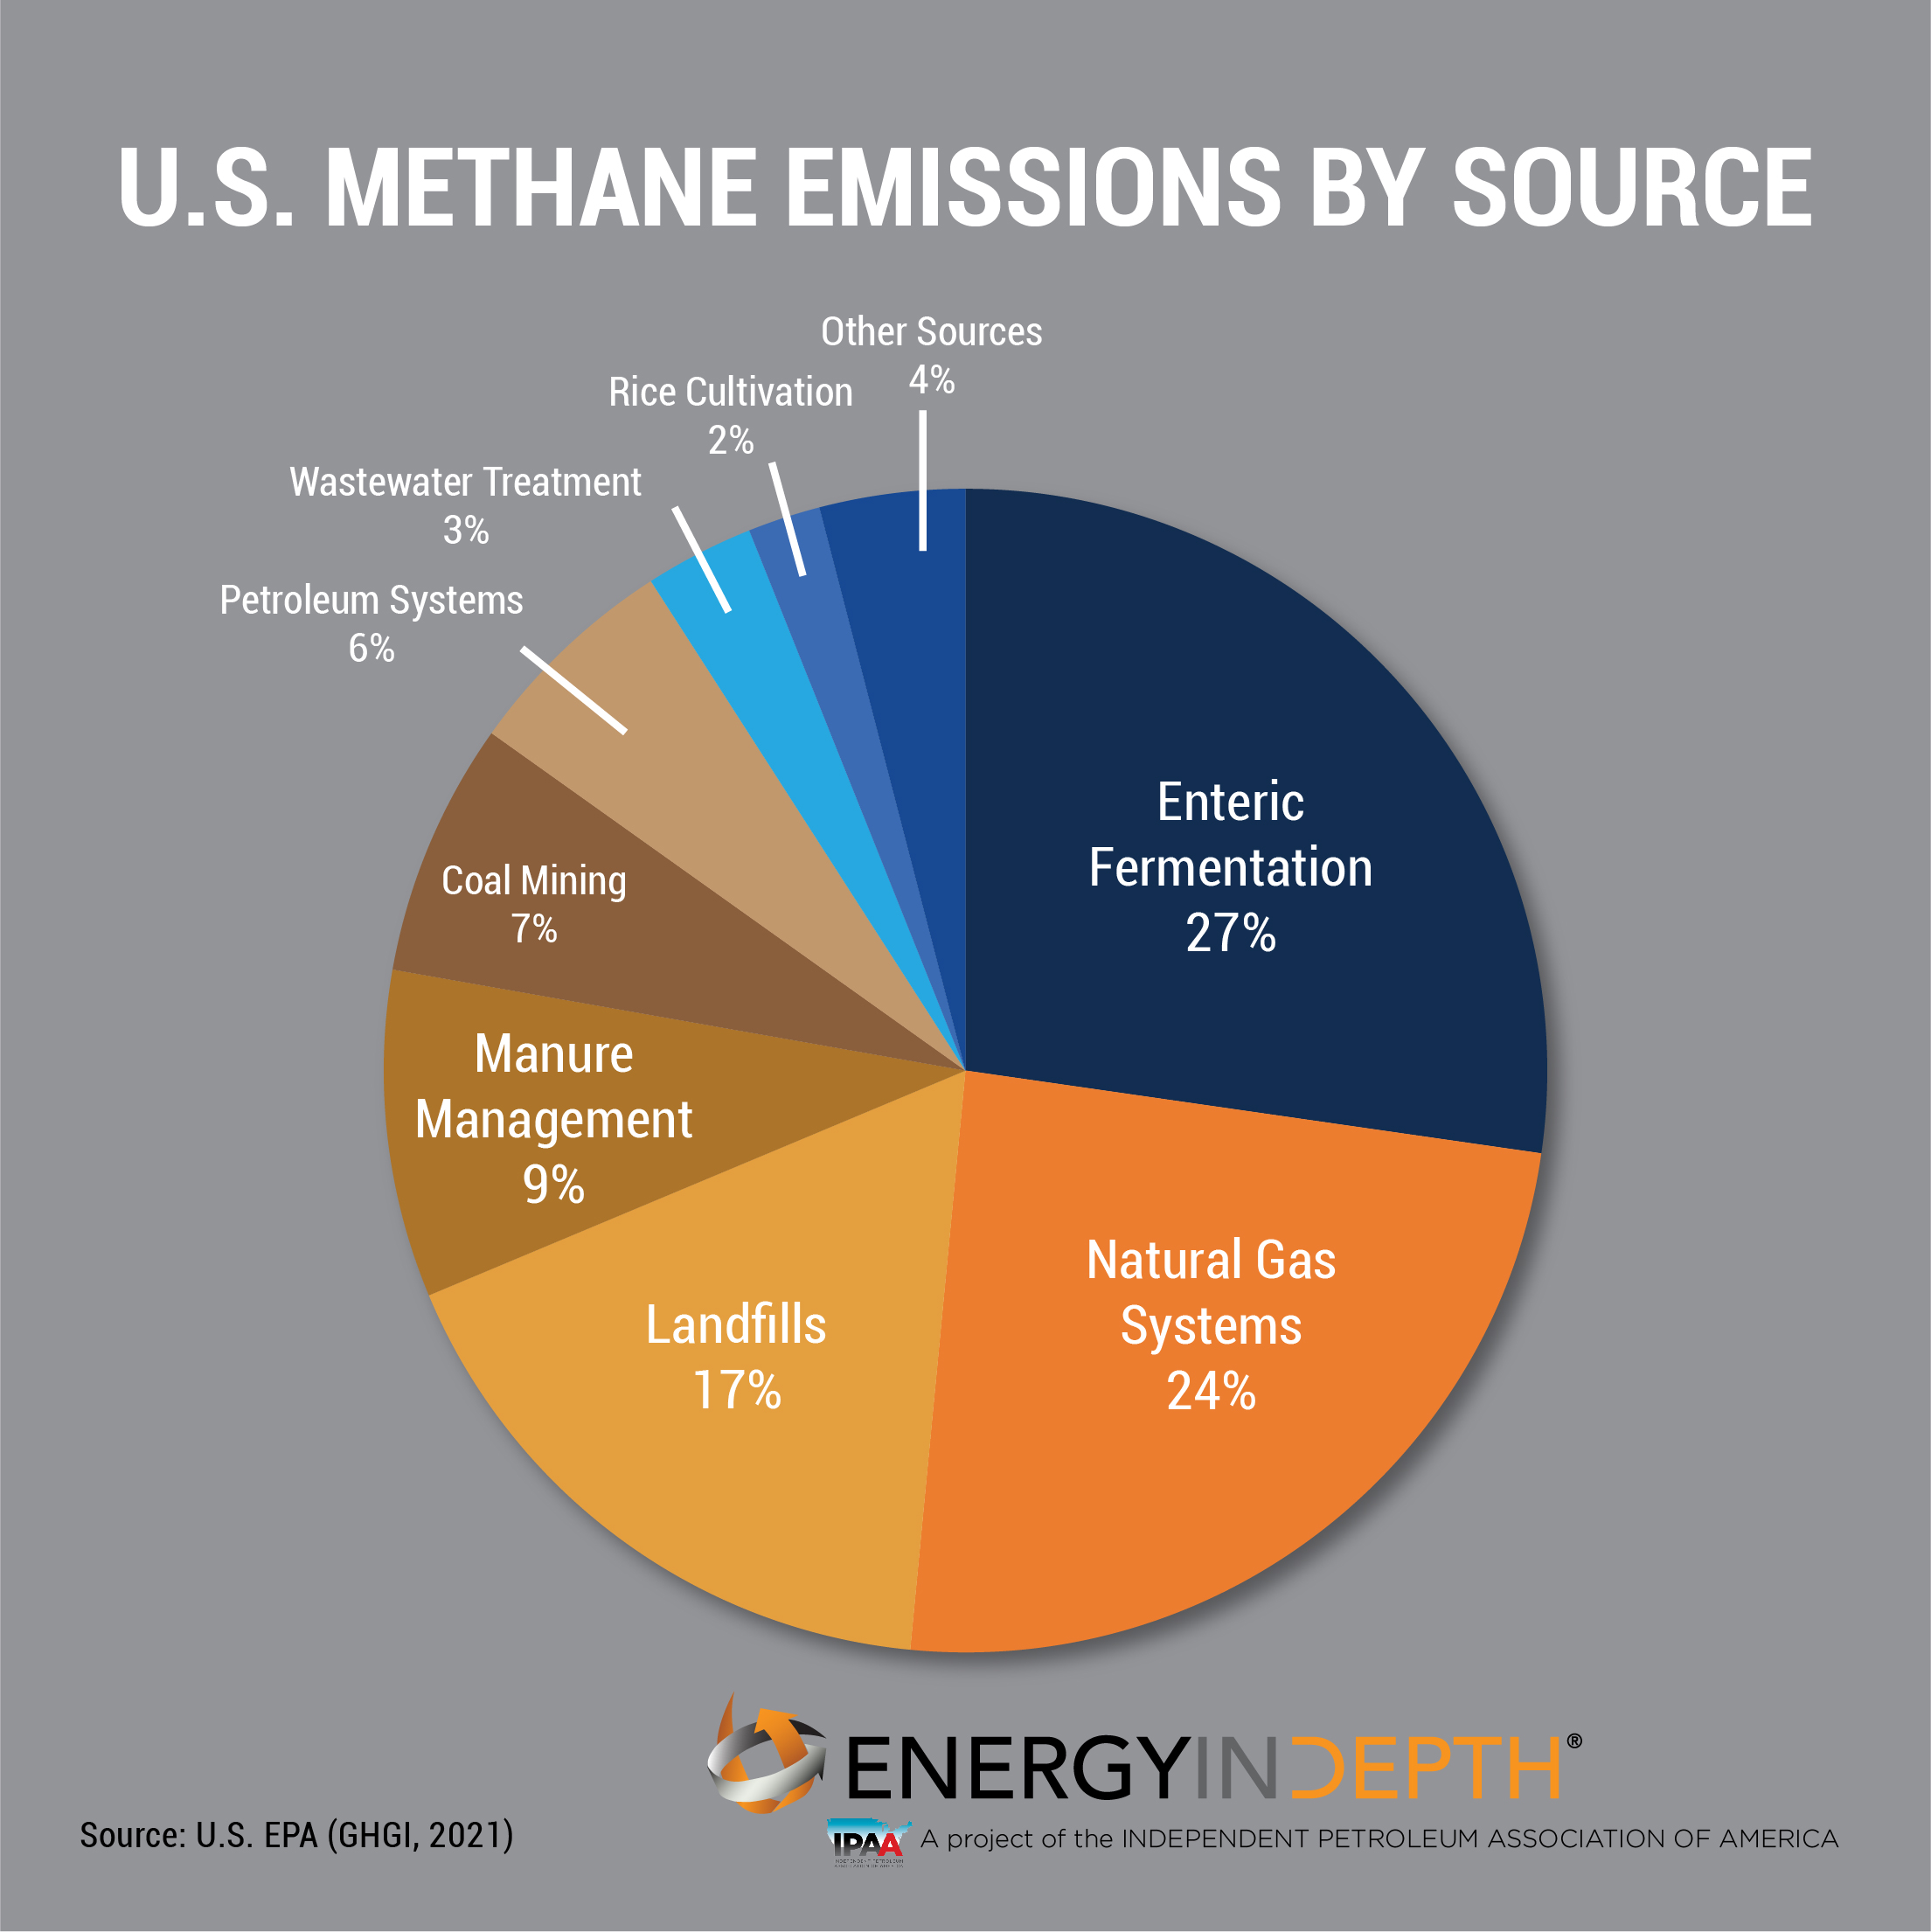
Percentage of U.S. Methane Emissions, 2019
Infographics
Apr 20, 2021
U.S. Oil & Gas Methane Emissions, 1990-2019
Infographics
Apr 20, 2021
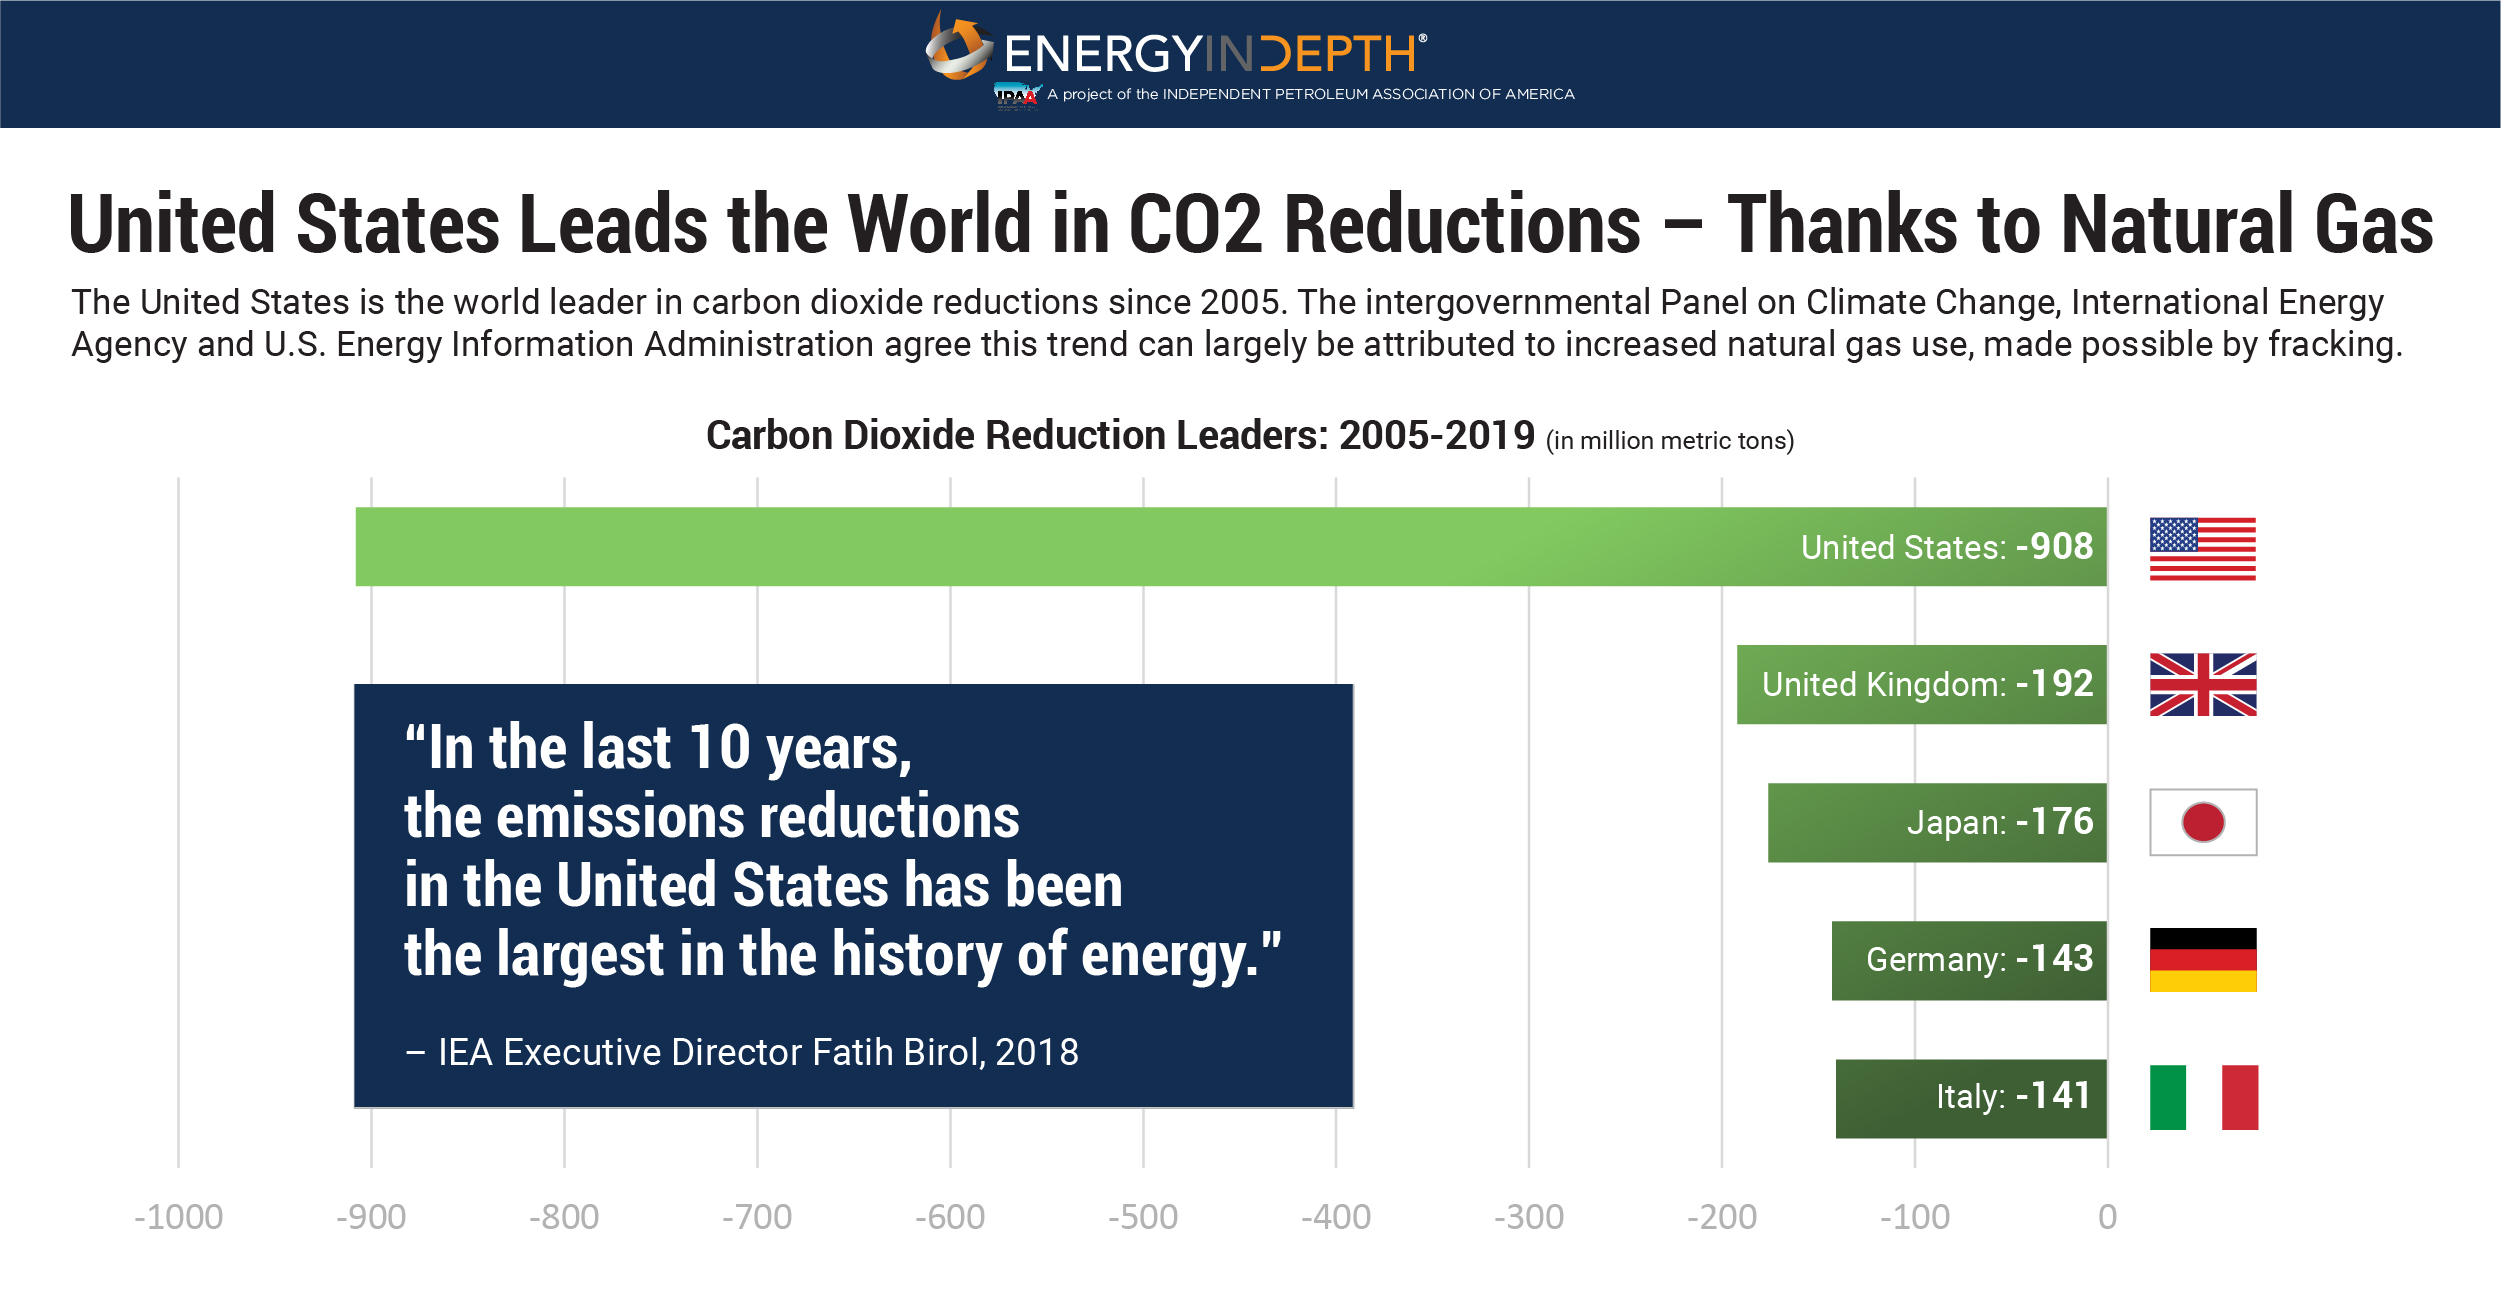
U.S. Leads the World in CO2 Emissions Reductions, 2005-2019
Infographics
Sep 28, 2020
What Are They Saying: Appalachian Basin Natural Gas
Infographics
Nov 19, 2019
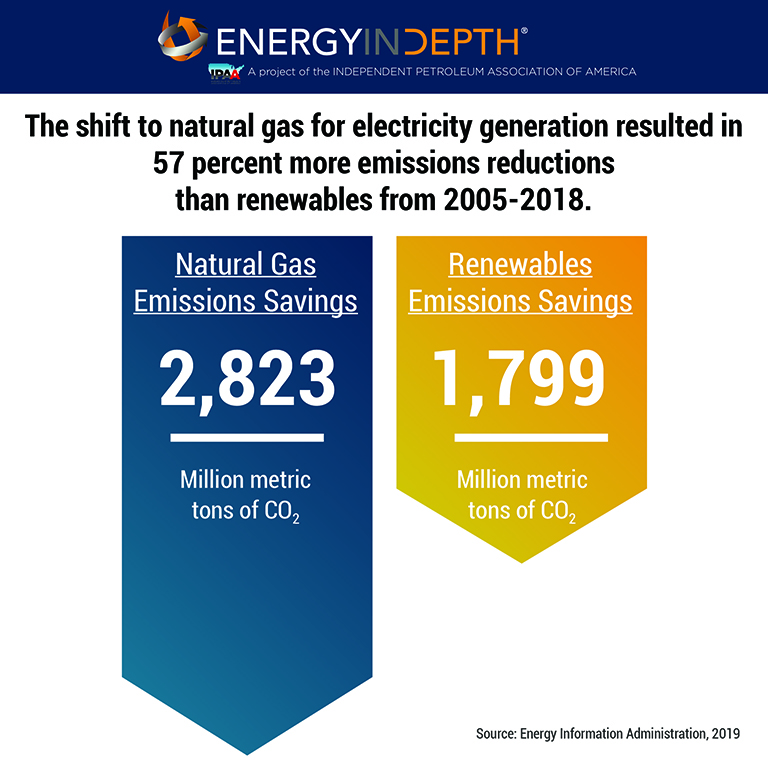
Natural Gas Versus Renewable Emissions Savings, 2005-2018
Infographics
Jun 11, 2019
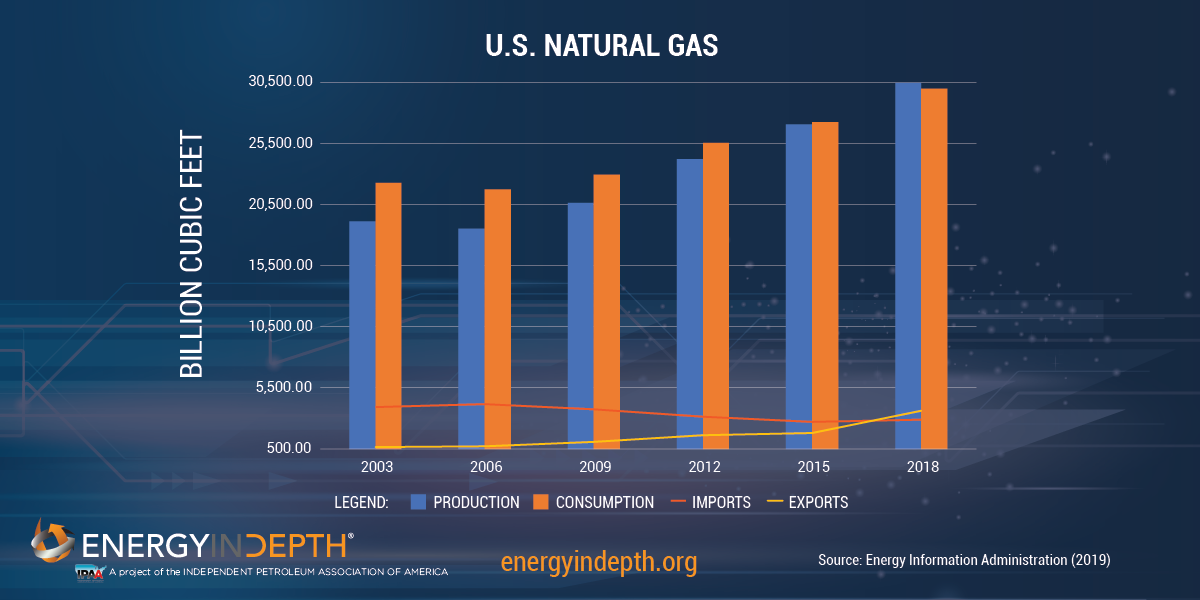
U.S. Natural Gas Stats, 2003-2018
Infographics
Jun 11, 2019
U.S. Natural Gas Imports and Exports, 2003-2018
Infographics
Jun 11, 2019
U.S. LNG Imports and Exports, 2003-2018
Infographics
Apr 25, 2019
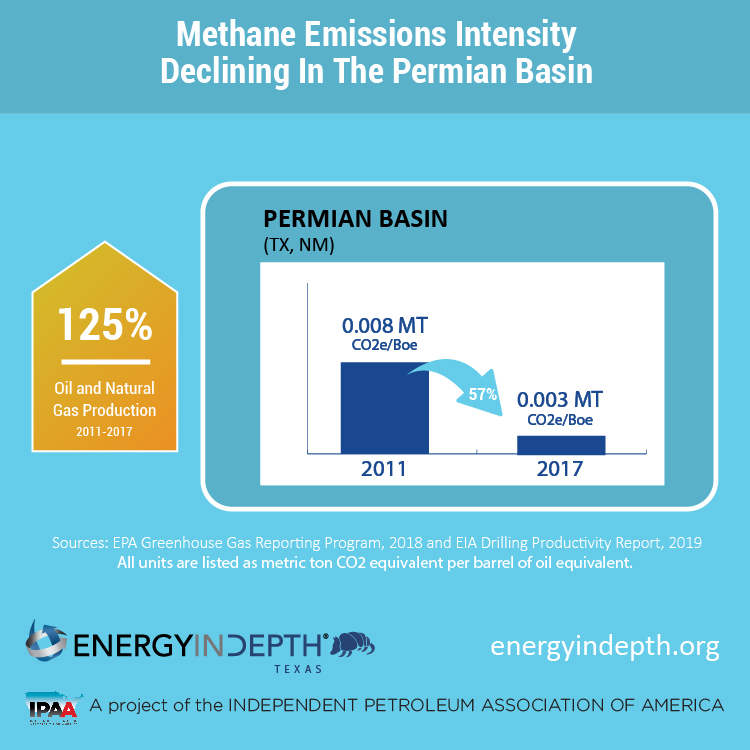
Methane Emissions Intensity Declining in the Permian Basin
1
2
3
4
5
6
7
8