Infographics Oct 09, 2018 Infographic: Natural Gas Power Plants Bring Major Investment, Jobs to the Appalachian Basin
Infographics Oct 03, 2018 Infographic: United States Leads World in CO2 Reductions — Thanks to Natural Gas
Infographics Aug 03, 2018 Infographic: Thanks to New York’s Fracking Ban, “Twin Tiers” Now Look More Like Distant Cousins
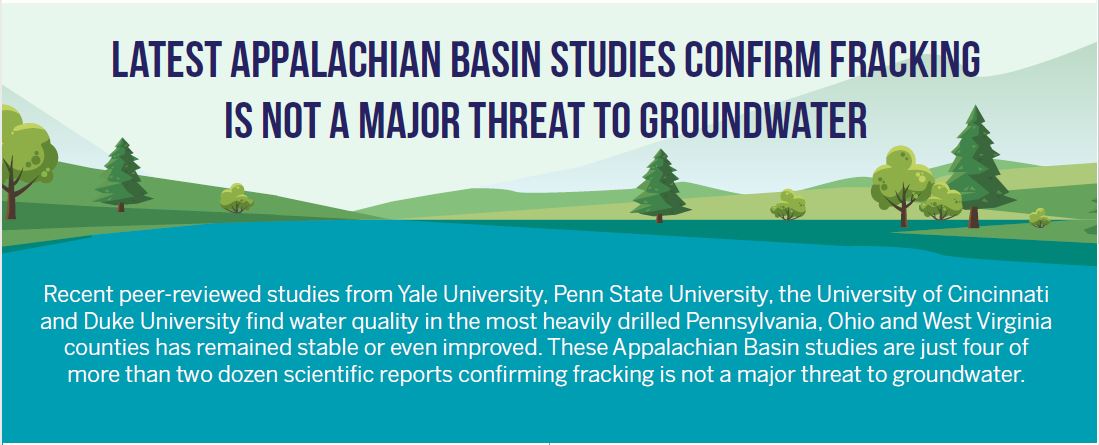
Infographics Jun 28, 2018 Infographic: Latest Appalachian Basin Studies Confirm Fracking Is Not A Major Threat to Groundwater
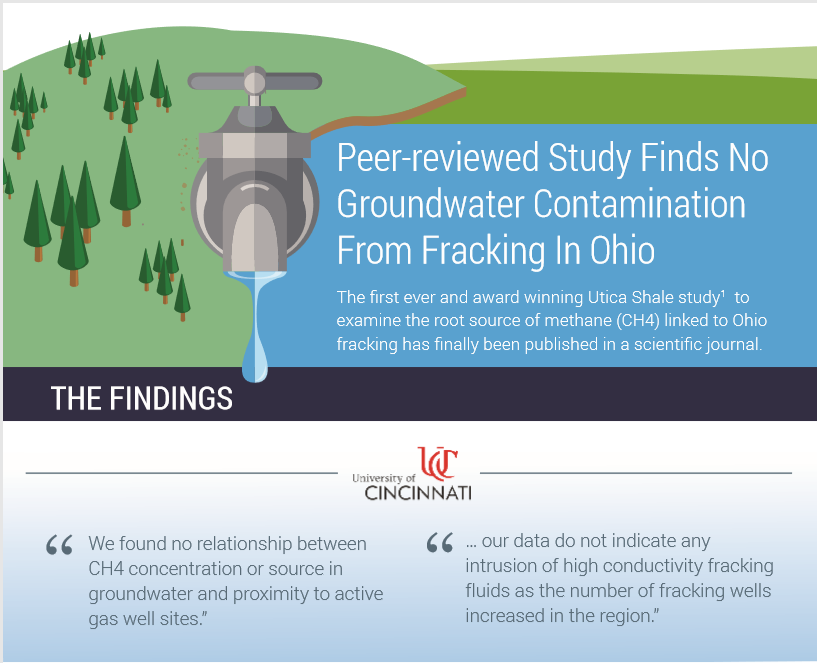
Infographics May 07, 2018 Infographic: Peer-Reviewed Scientific Study Finds No Groundwater Contamination From Fracking in Ohio