Home
About
Fracking 101
Resources
All
Fact Sheets
Infographics
Videos
Gasland Debunked
Regions
All
National
California
Florida
Mountain States
New Mexico
App. Basin
Texas
Canada
Key Issues
Health
Climate
Pavillion
Federal Lands
old Home
Resources
Fact Sheets
Infographics
Videos
Resources
Fact sheets
Mar 10, 2022
Get The Facts: Federal Oil and Natural Gas Leases
infographics
Feb 07, 2022
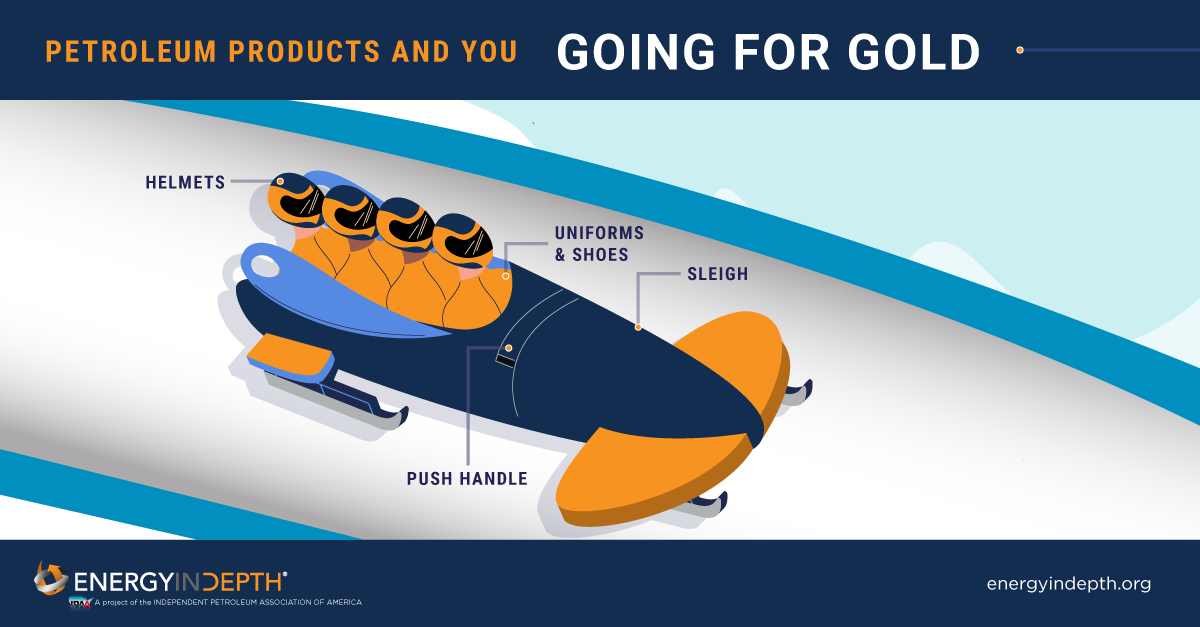
Petroleum and You: Going For Gold
infographics
Feb 07, 2022
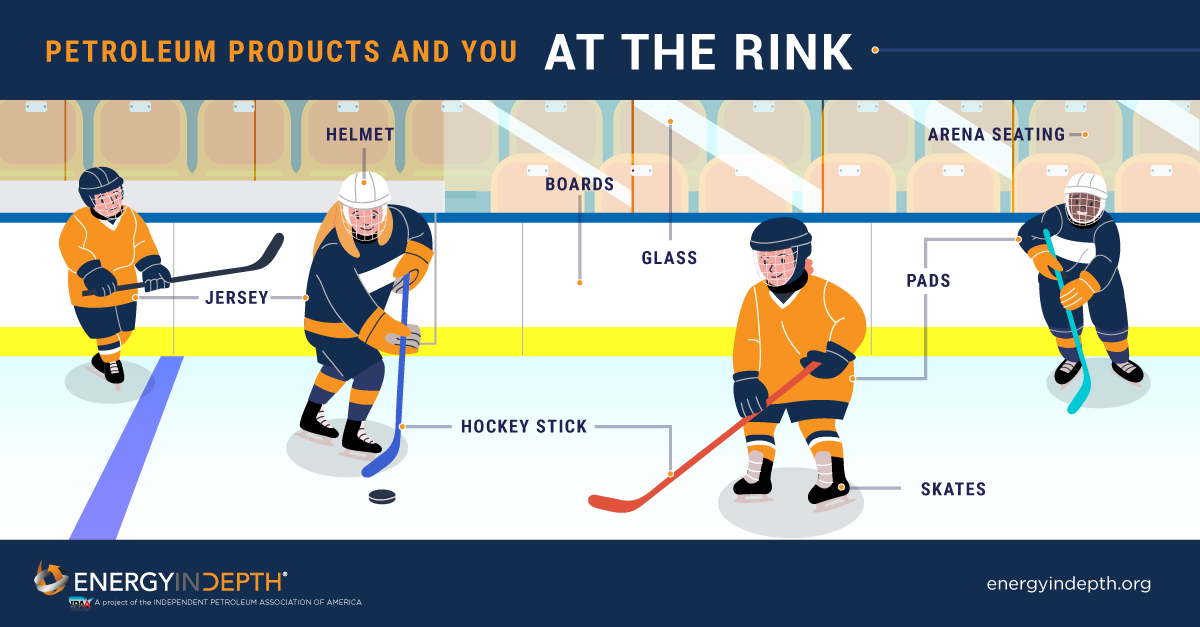
Petroleum and You: At The Rink
infographics
Feb 07, 2022
Petroleum and You: On The Mountain
infographics
Jan 31, 2022
Petroleum and You: Snow Day
infographics
Dec 21, 2021
Petroleum and You: Holiday Edition
videos
Apr 20, 2021
Energy Development on Federal Lands: Let’s Work Together
videos
Apr 20, 2021
An Oil & Gas Federal Leasing Ban Will Be Devastating
infographics
Apr 20, 2021
U.S. GHG Emissions, 2005-2019
infographics
Apr 20, 2021
U.S. Power Sector CO2 Emissions, 2005-2019
infographics
Apr 20, 2021
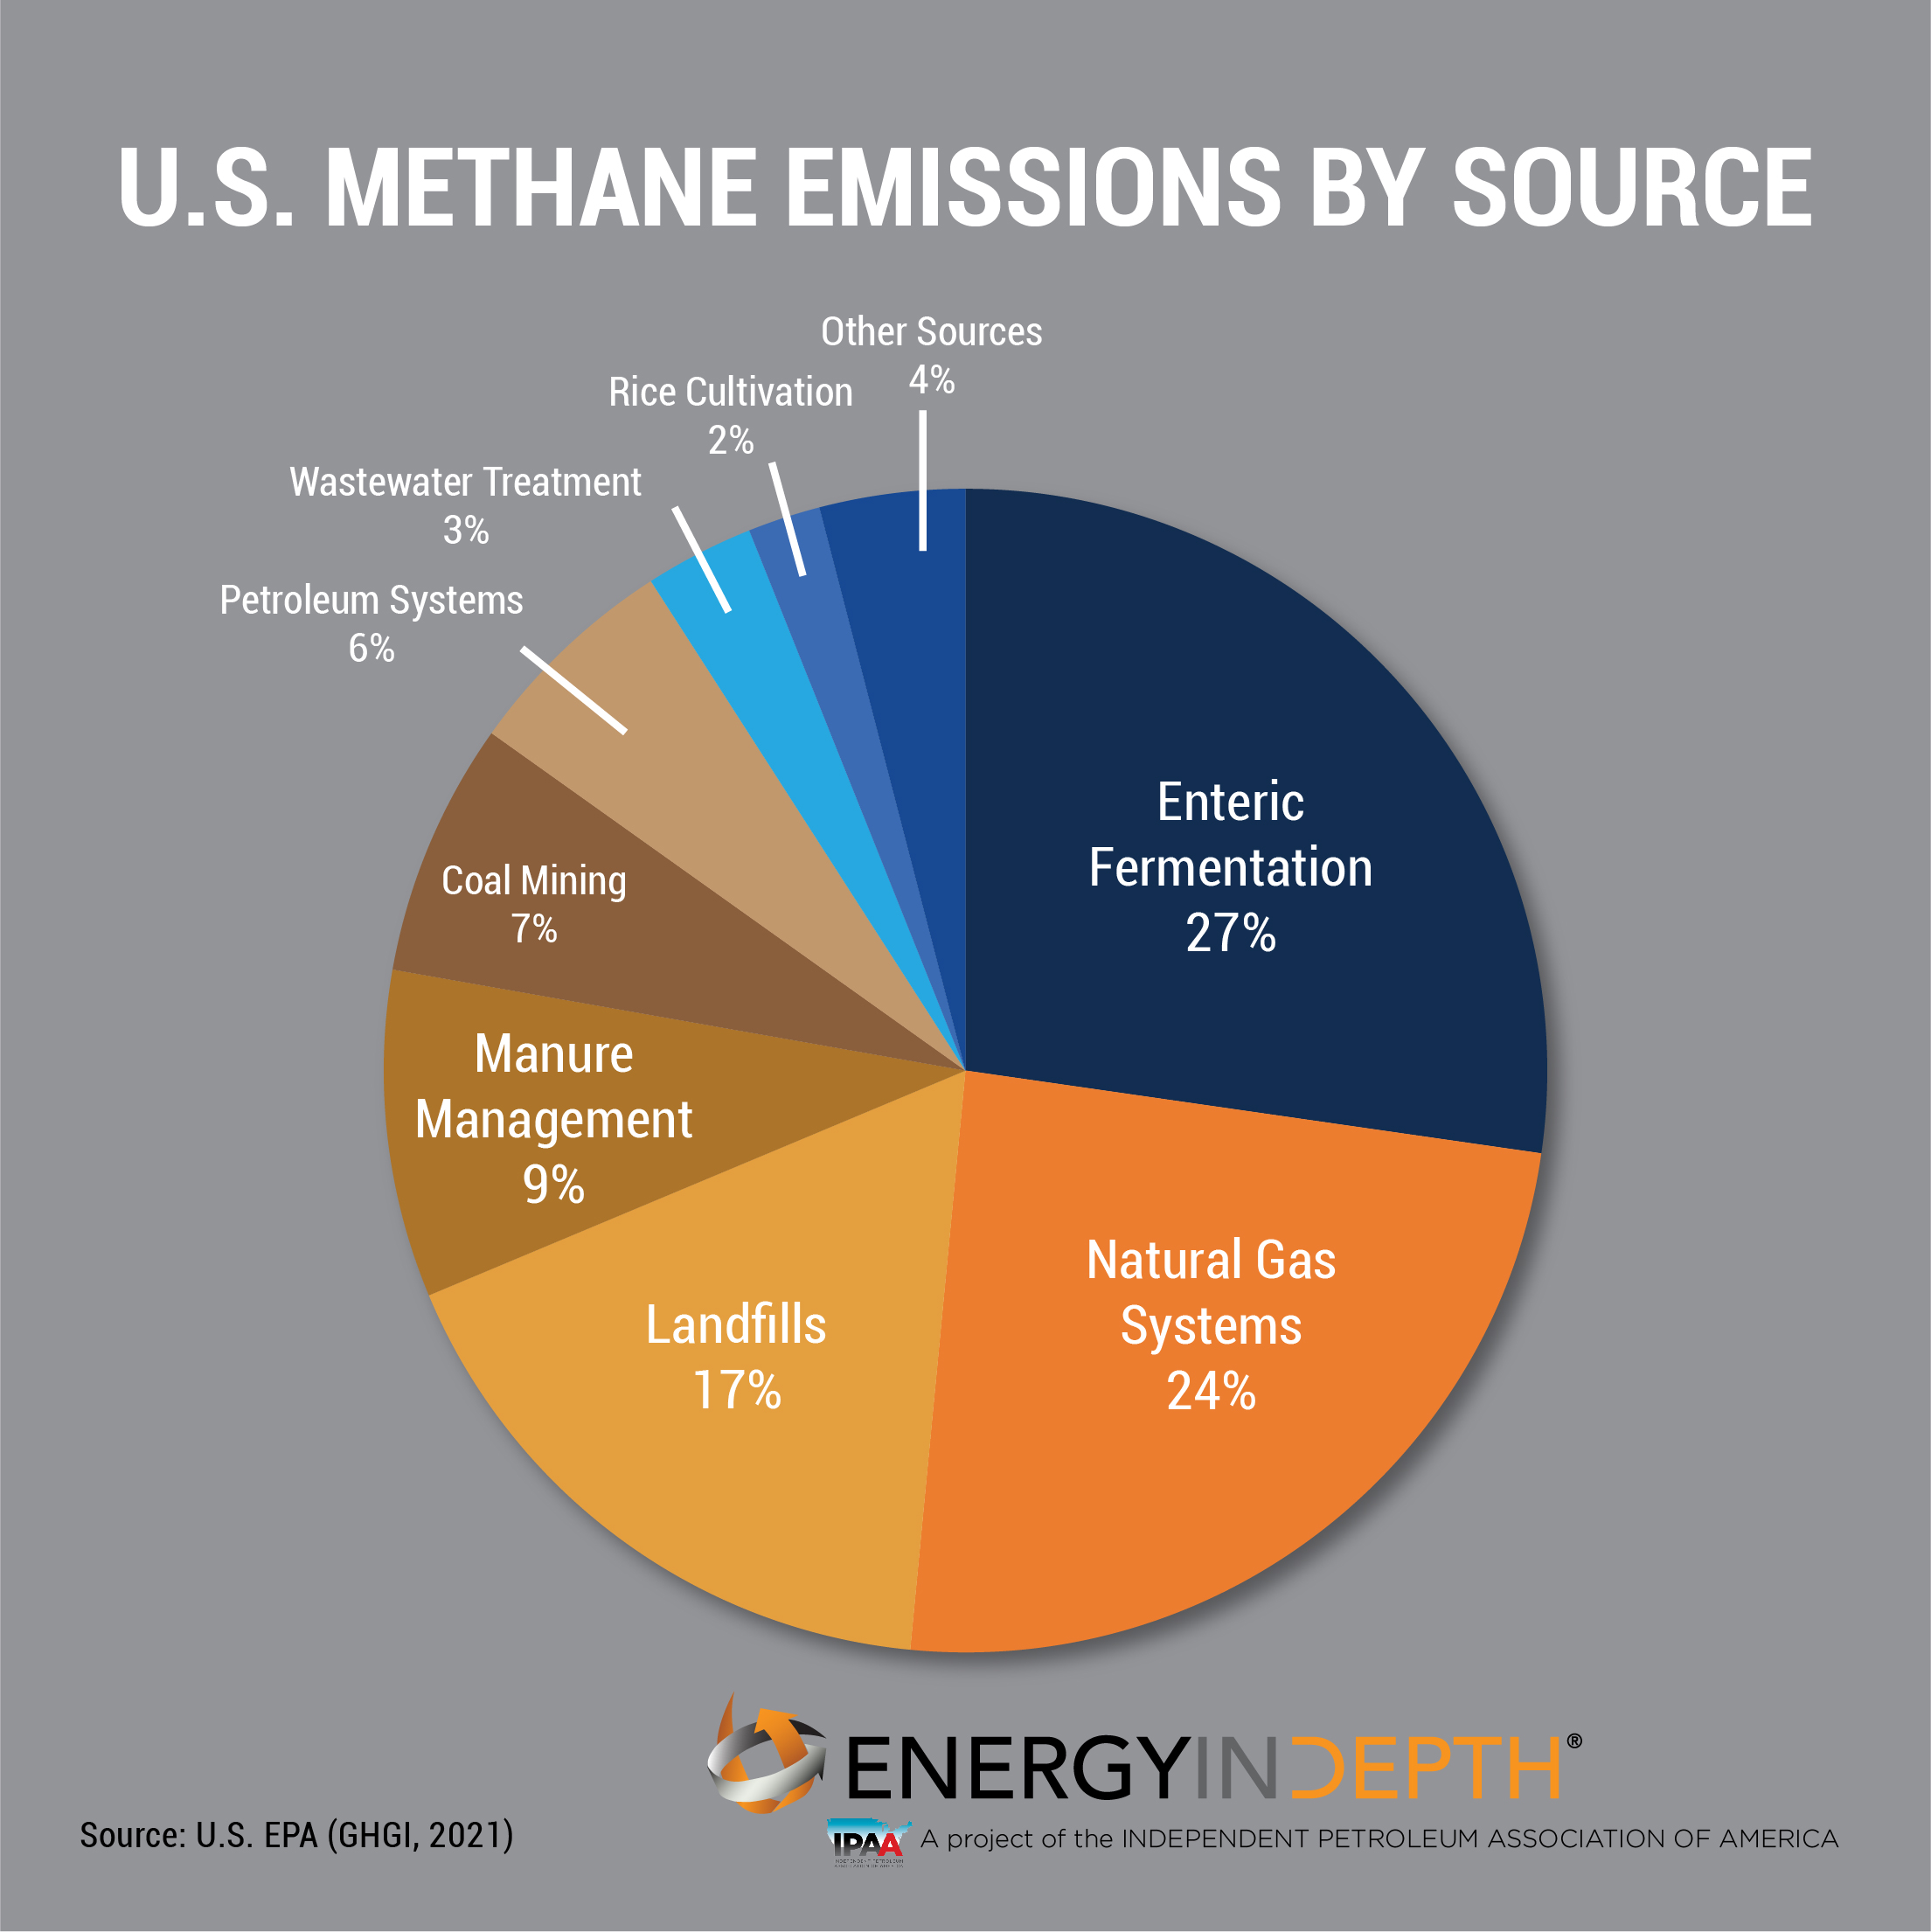
Percentage of U.S. Methane Emissions, 2019
infographics
Apr 20, 2021
U.S. Oil & Gas Methane Emissions, 1990-2019
1
2
3
4
5
6
7
8