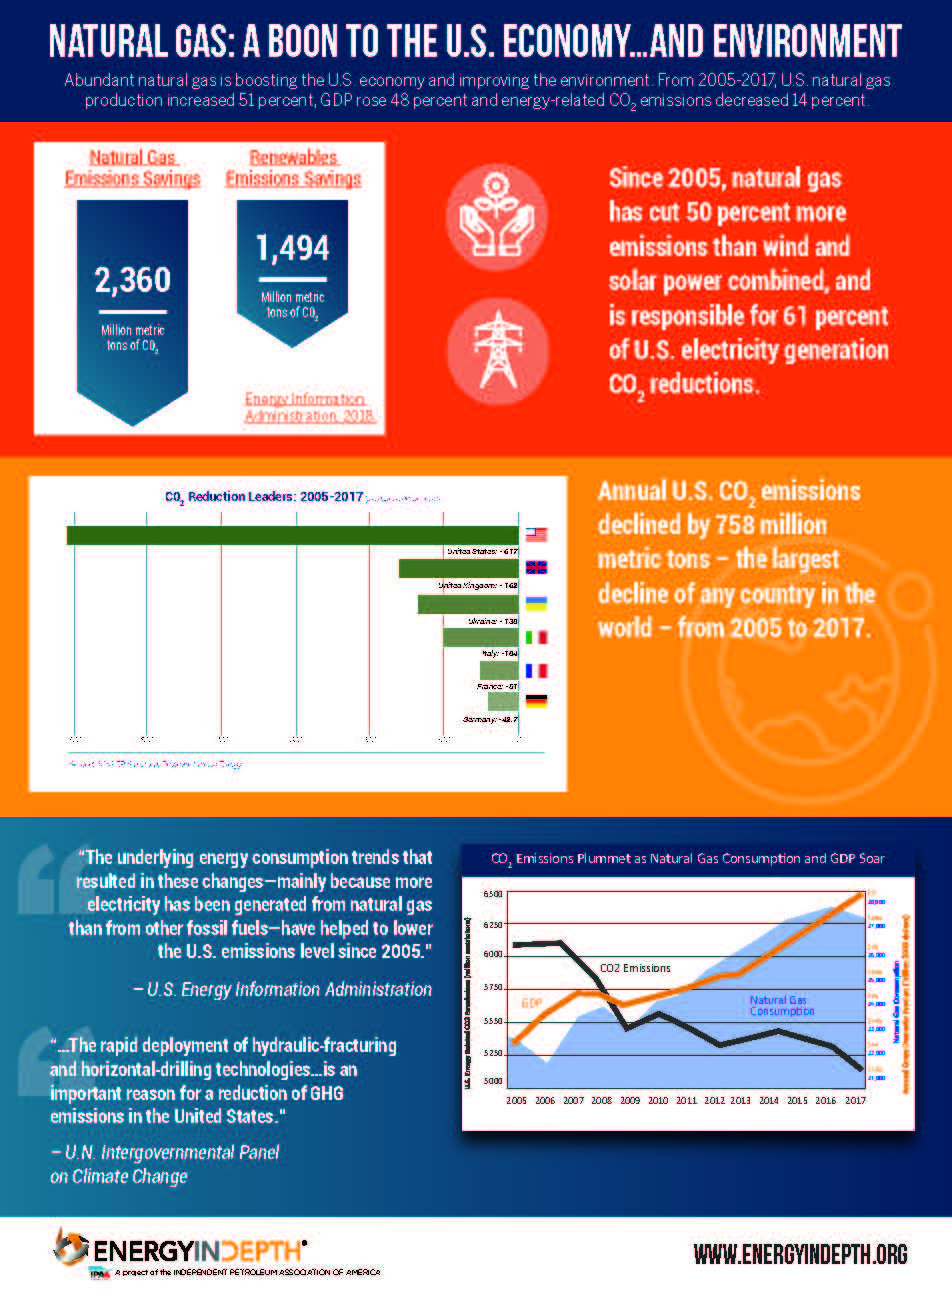
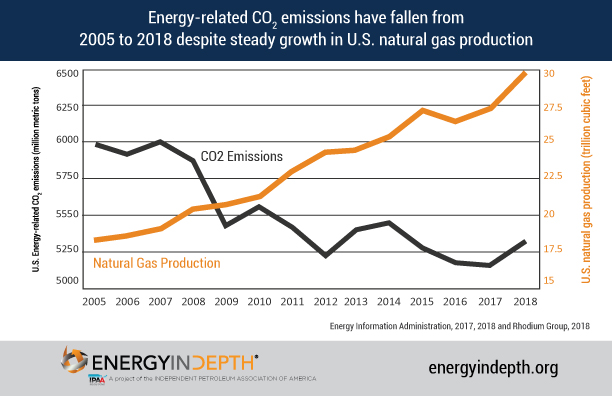
infographics Jan 11, 2019 Energy-Related CO2 Emissions Decline Despite Steady Growth in U.S. Natural Gas Production
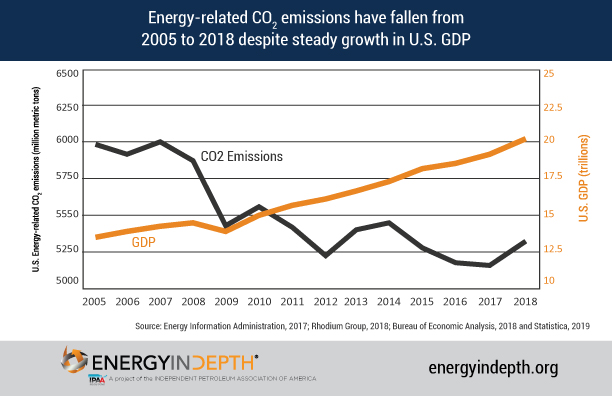
infographics Jan 11, 2019 Energy-Related CO2 Emissions Decline Despite Steady Growth in U.S. Oil Production
infographics Jan 11, 2019 Energy-Related CO2 Emissions Decline Despite Steady Growth in U.S. Registered Vehicles
infographics Jan 11, 2019 Energy-Related CO2 Emissions Decline Despite Steady Growth in U.S. Population