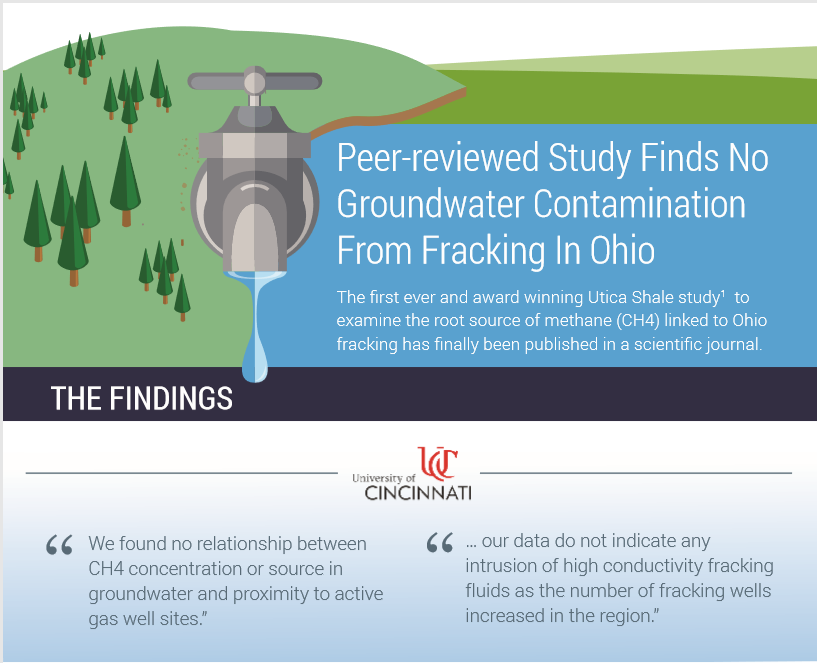
Logo Logo Logo Logo Logo

  • Home
  • About
  • Fracking 101
  • Resources
    • All
    • Fact Sheets
    • Infographics
    • Videos
  • Gasland Debunked
  • Regions
    • All
    • National
    • California
    • Florida
    • Mountain States
    • New Mexico
    • App. Basin
    • Texas
    • Canada
  • Key Issues
    • Health
    • Climate
    • Pavillion
    • Federal Lands
  • old Home
  • Resources
  • Fact Sheets
  • Infographics
  • Videos

Resources

infographics May 01, 2018

A Review of McKenzie Playbook from 2012-2018

Fact sheets Mar 18, 2018

Setting the Record Straight on ‘Aquifer Exemptions’ and Injection Wells in Texas

Fact sheets Mar 12, 2018

The Real Threat to Grid Reliability in New England: Inadequate Energy Infrastructure

infographics Mar 12, 2018

Infographic: DOE’s Grid Resilience & Reliability NOPR

Fact sheets Feb 22, 2018

Setting the Record Straight on ‘Aquifer Exemptions’ and Injection Wells in Wyoming

Fact sheets Feb 18, 2018

Setting the Record Straight on ‘Aquifer Exemptions’ and Injection Wells

infographics Jan 18, 2018

DRBC vs. SRBC

infographics Jan 04, 2018

Oklahoma Earthquakes Decreased 58 Percent in 2017

infographics Dec 20, 2017

Report: Methane Emissions Continue to Decline in Top Oil and Gas Basins

Fact sheets Nov 15, 2017

Activists Admit Methane FLIR Videos Not Supported by Scientific Analysis

infographics Jul 20, 2017

Tourism and Petroleum Industries Thrive in America’s Gulf Coast States

infographics Jun 29, 2017

Tourism Industry Is Thriving in Top Oil & Gas Producing States

  • 6
  • 7
  • 8
  • 9
  • 10
  • 11
  • 12
  • 13
  • 14
logo
A PROJECT OFlogo

© IPAA,2026. All Rights Reserved | Privacy Policy | Contact Us