Home
About
Fracking 101
Resources
All
Fact Sheets
Infographics
Videos
Gasland Debunked
Regions
All
National
California
Florida
Mountain States
New Mexico
App. Basin
Texas
Canada
Key Issues
Health
Climate
Pavillion
Federal Lands
old Home
Resources
Fact Sheets
Infographics
Videos
Resources
infographics
Nov 04, 2018
Federal Lands and Oil & Gas Development: Western Mountain States
infographics
Nov 04, 2018
Federal Lands and Oil & Gas Development: Colorado
infographics
Nov 04, 2018
Federal Lands and Oil & Gas Development: Montana
infographics
Nov 04, 2018
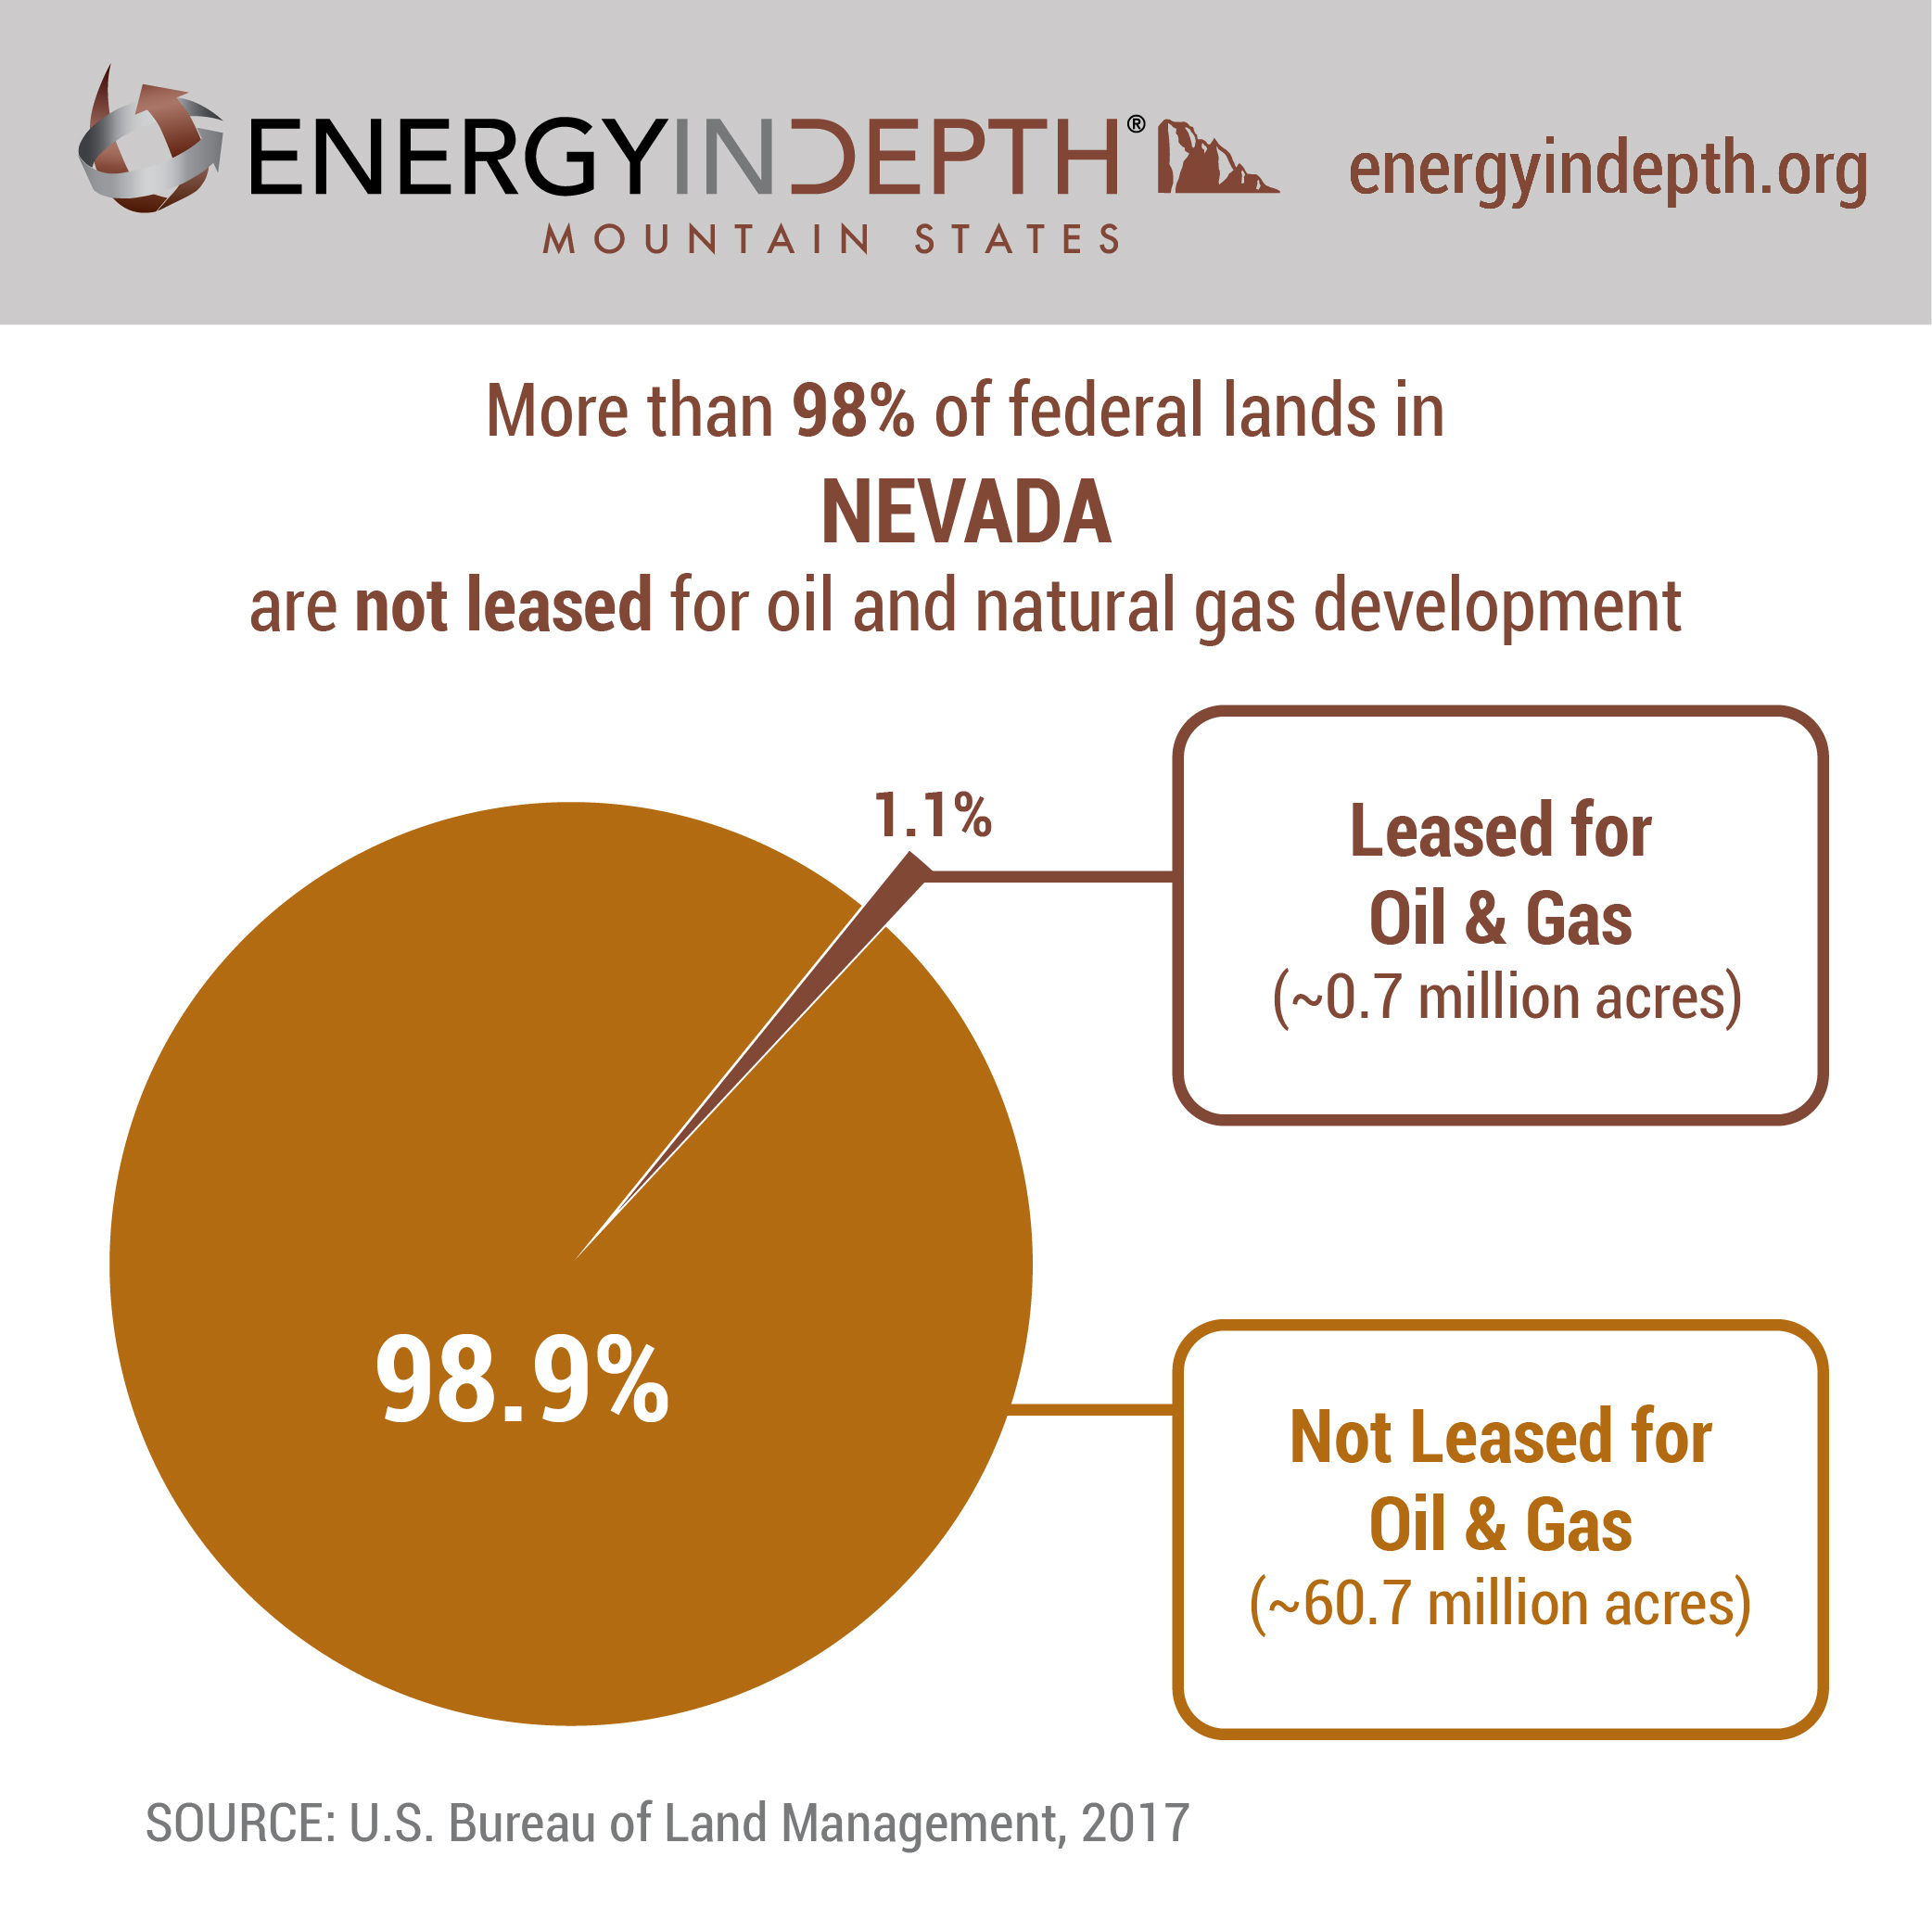
Federal Lands and Oil & Gas Development: Nevada
infographics
Nov 04, 2018
Federal Lands and Oil & Gas Development: New Mexico
infographics
Nov 04, 2018
Federal Lands and Oil & Gas Development: North Dakota
infographics
Nov 04, 2018
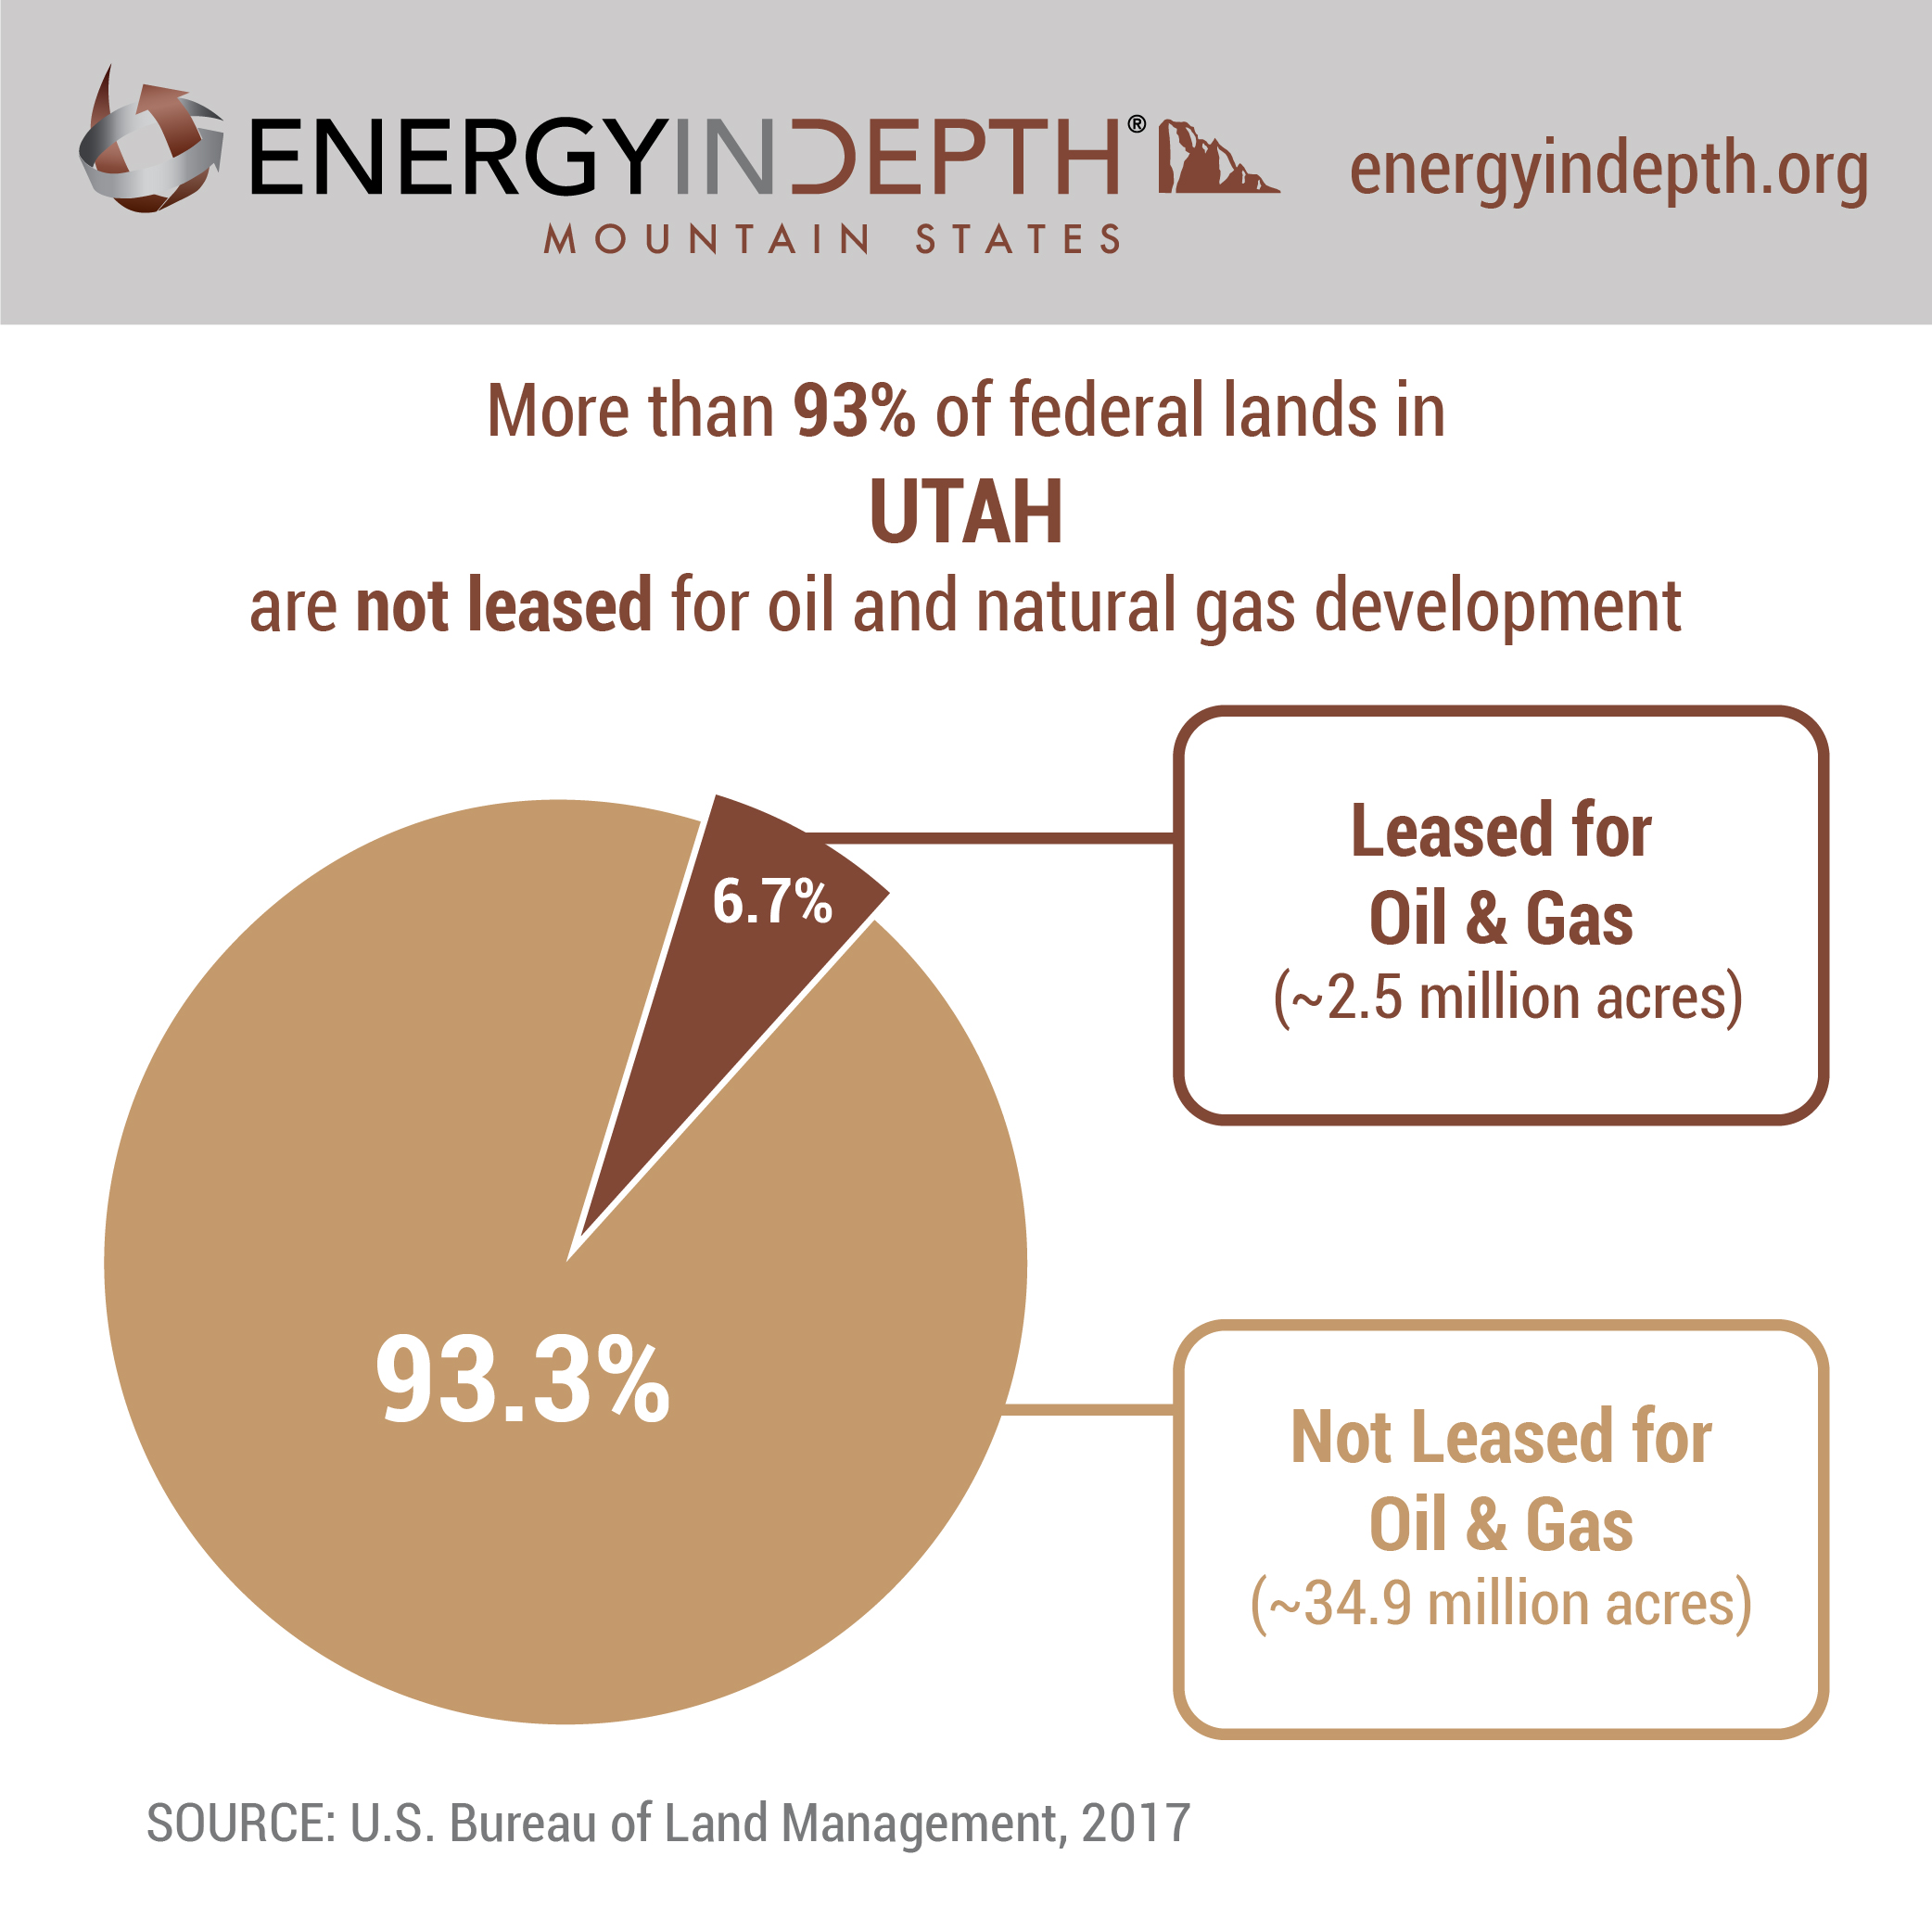
Federal Lands and Oil & Gas Development: Utah
infographics
Nov 04, 2018
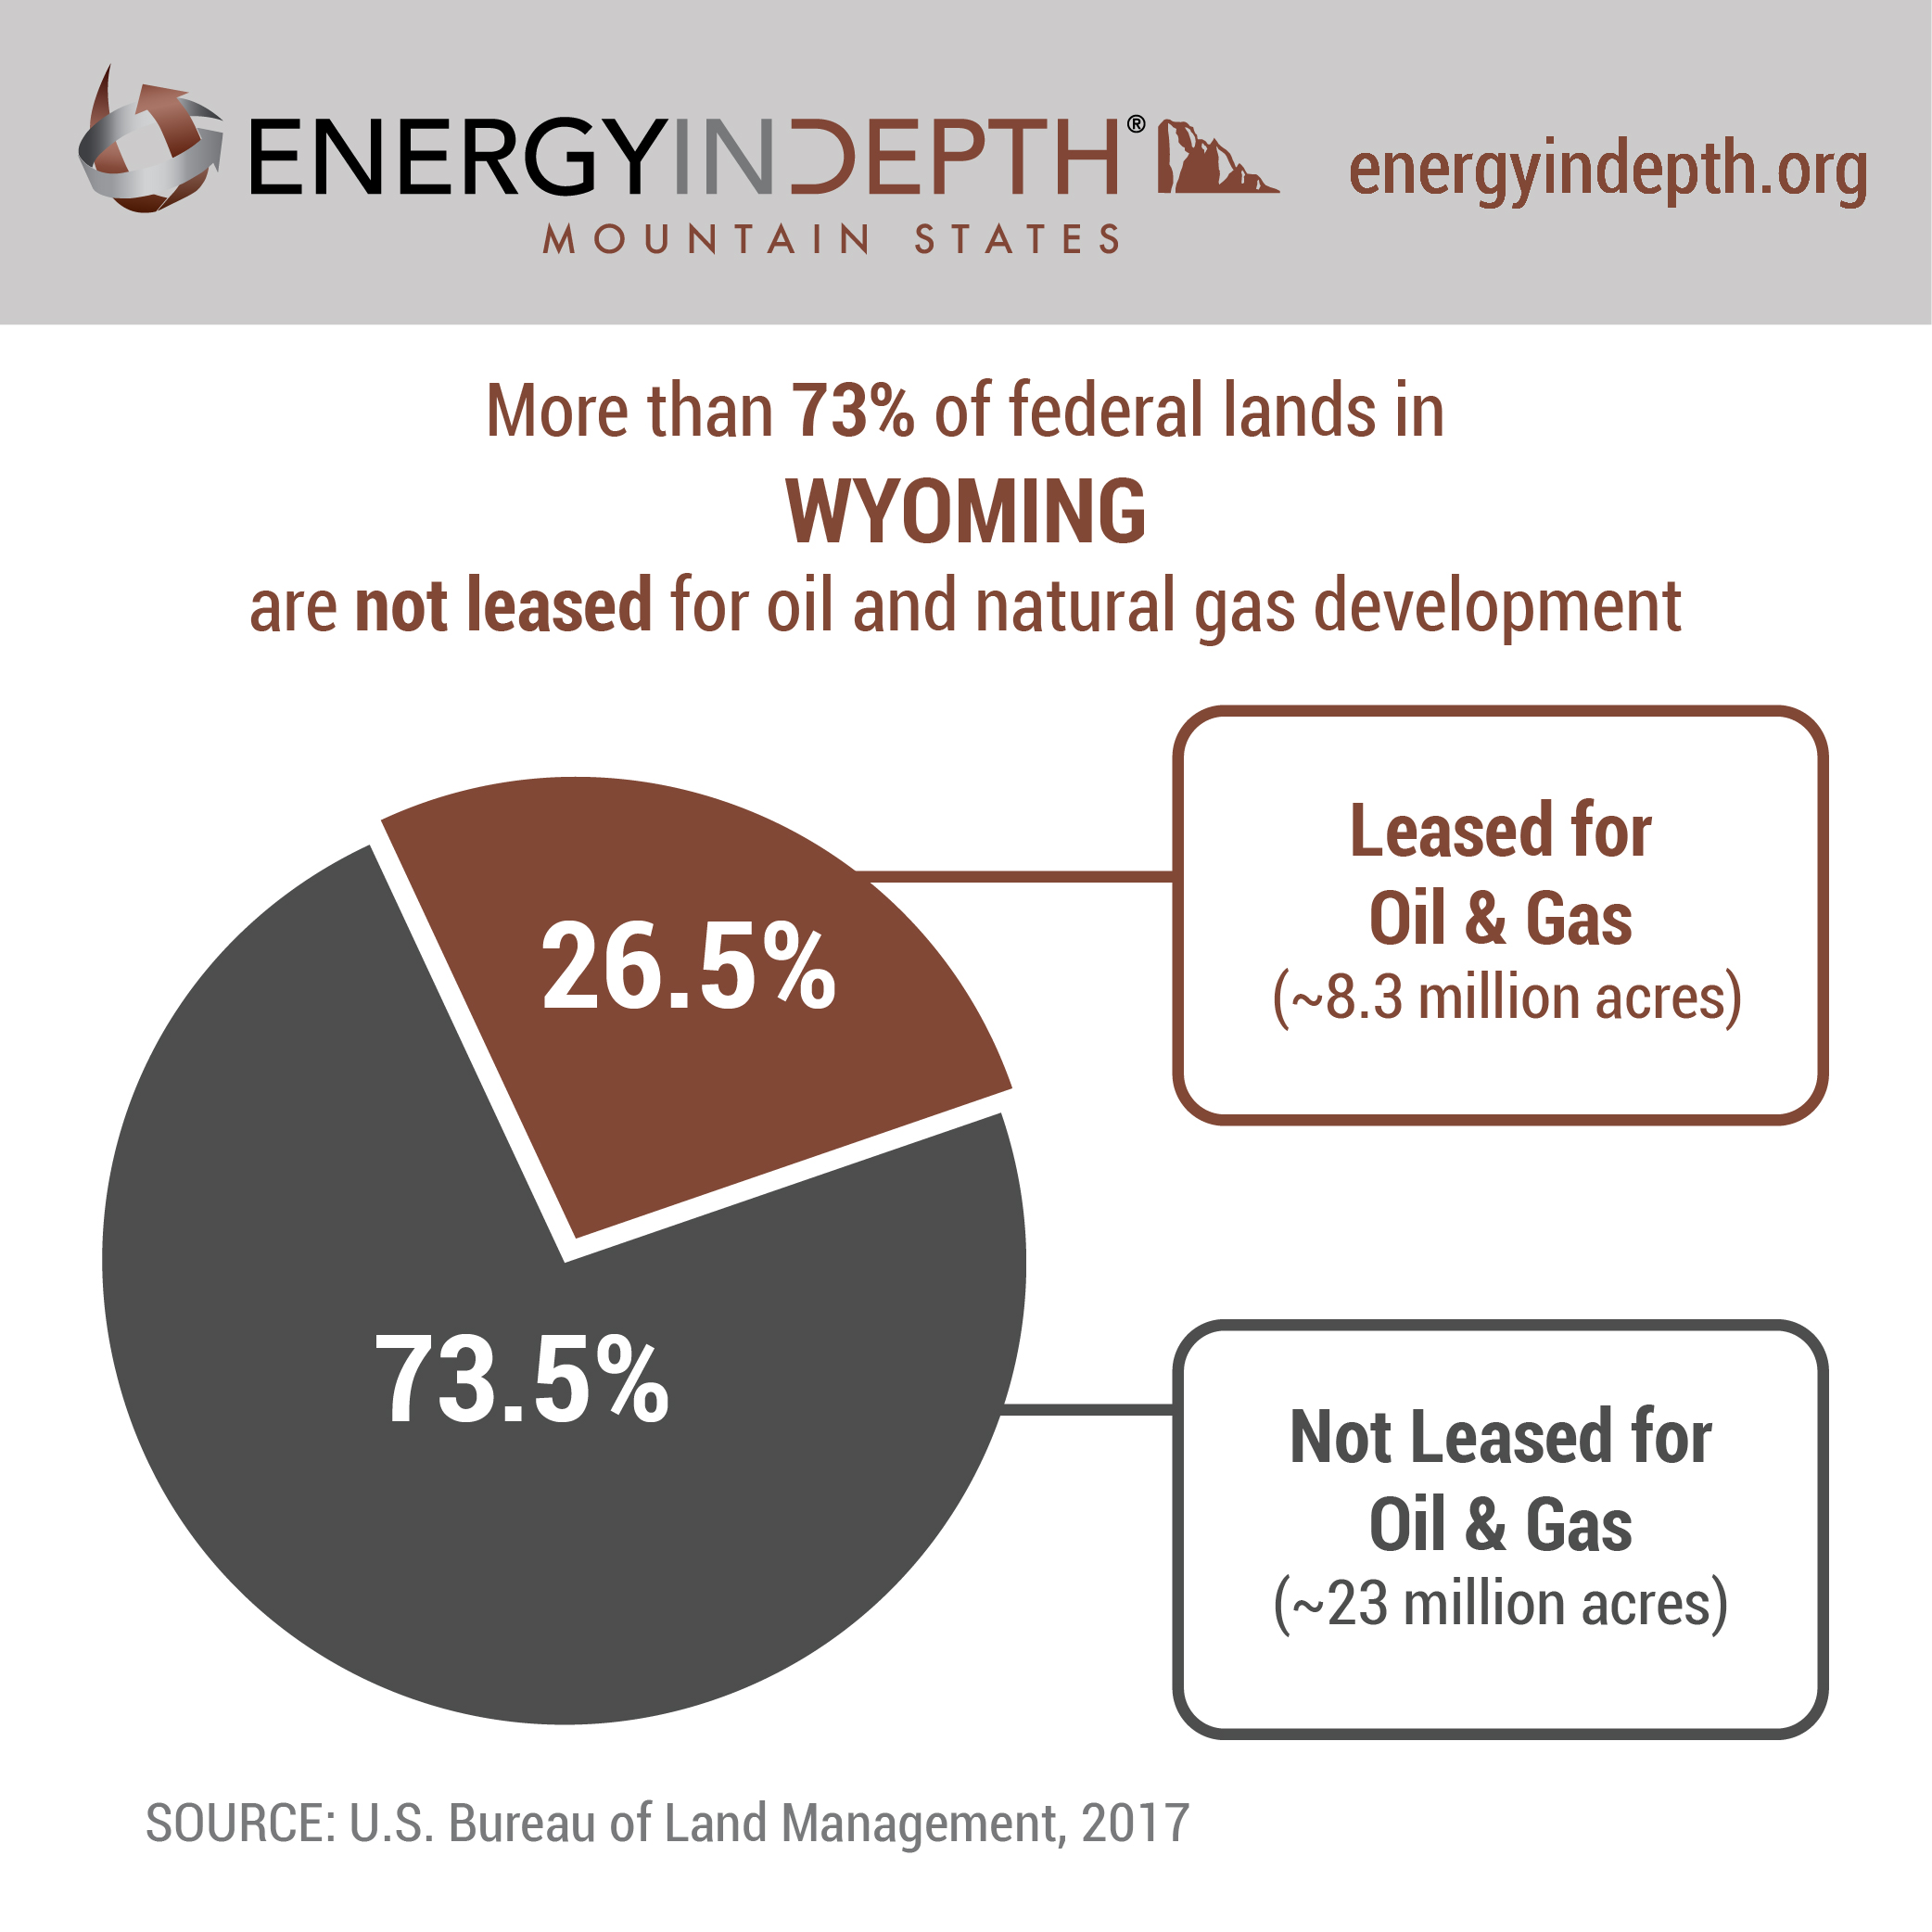
Federal Lands and Oil & Gas Development: Wyoming
infographics
Nov 04, 2018
U.S. Proved Natural Gas Reserves in 2017
infographics
Nov 04, 2018
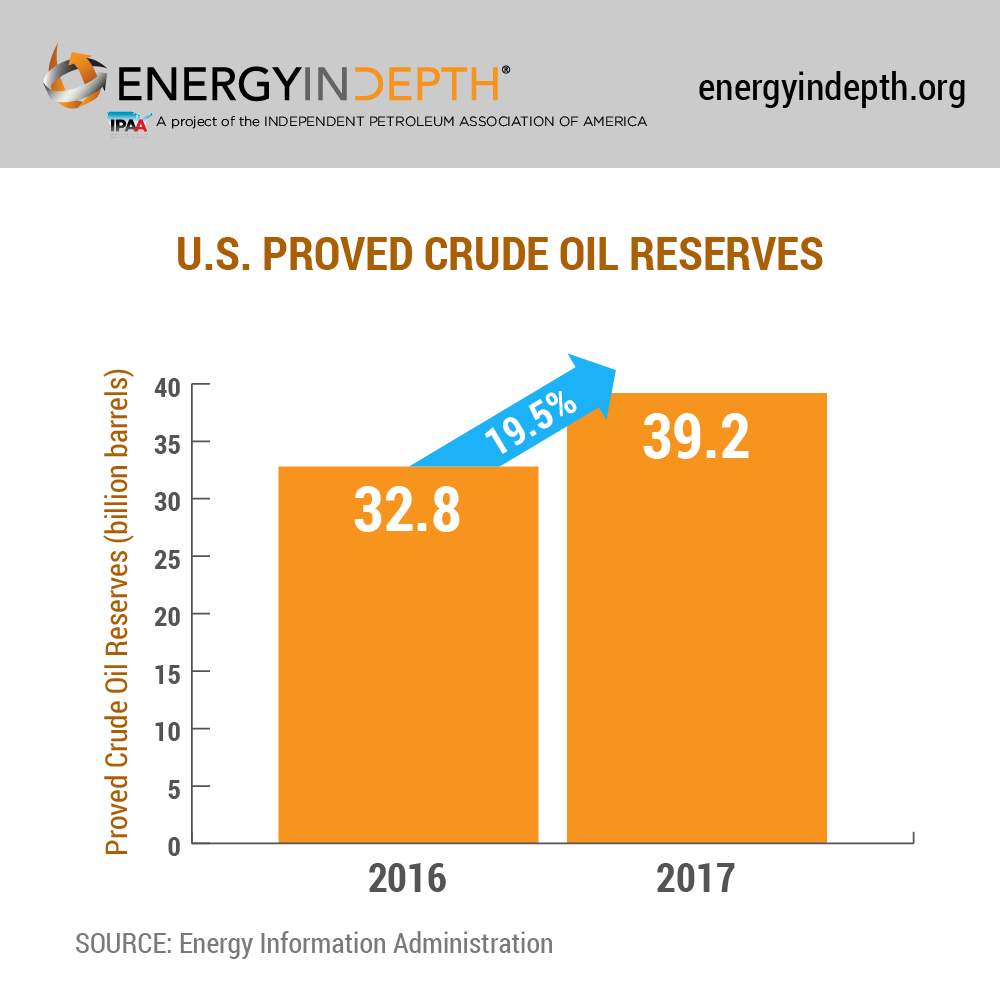
U.S. Proved Crude Oil Reserves in 2017
infographics
Nov 04, 2018
Percentage of U.S. Shale Proved Reserves 2008 vs. 2017
infographics
Nov 04, 2018
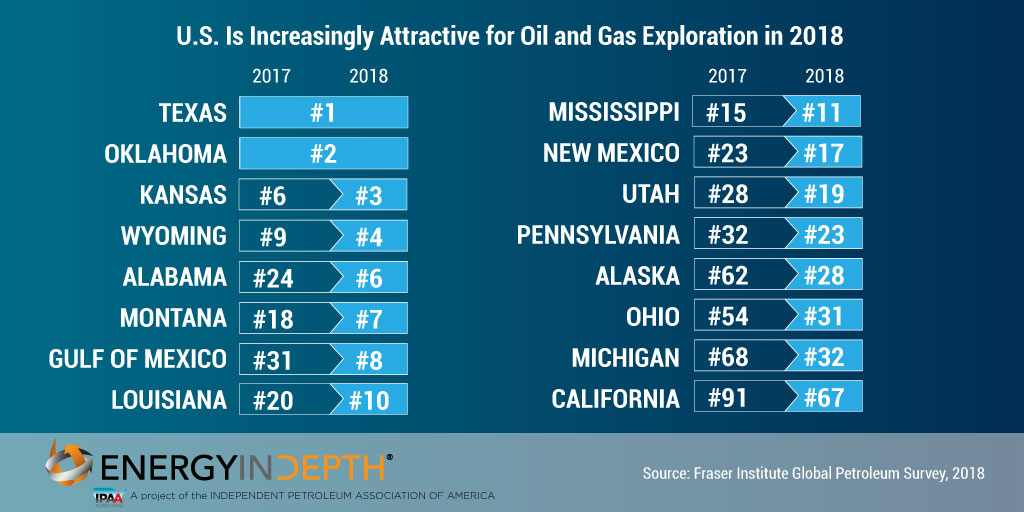
U.S. Is Increasingly Attractive for Oil & Gas Exploration in 2018
4
5
6
7
8
9
10
11
12